chart icon
Physician Group Performance Management

Your teams are making decisions without a clear view of what’s driving performance

RSI connects data across marketing, operations, clinical, and revenue workflows so teams can:

See how departments impact patient revenue
Identify what’s driving performance issues
Make objective decisions
RSI platform showing how marketing, operations, clinical, and revenue departments connect and impact each other across the practice.
Top Pain Points for Physician Group Performance Management
02

Your teams are making decisions without connected visibility

X/cancel icon
You don’t have a single source of truth across your practice
X/cancel icon
Department KPIs don’t connect, making it hard to see cause and effect
X/cancel icon
Decisions rely on fragmented reports or gut instinct
X/cancel icon
Your decision process/culture is subjective versus objective
X/cancel icon
Reporting takes too long and still doesn’t give you answers
View off slash icon
Marketing & Referring Providers
No patient source or downstream visibility
warning icon with connect dot linewarning icon with connect dot line
calendar off icon
Scheduling and Clinical Operations
No patient journey visibility and fragmented workflows
warning icon with connect dot linewarning icon with connect dot line
Money Remove icon
RCM
No upstream visibility or control
warning icon with connect dot linewarning icon with connect dot line
target icon
Practice Alignment
No source of truth or forecast
How RSI Helps for Physician Group Performance Management
03

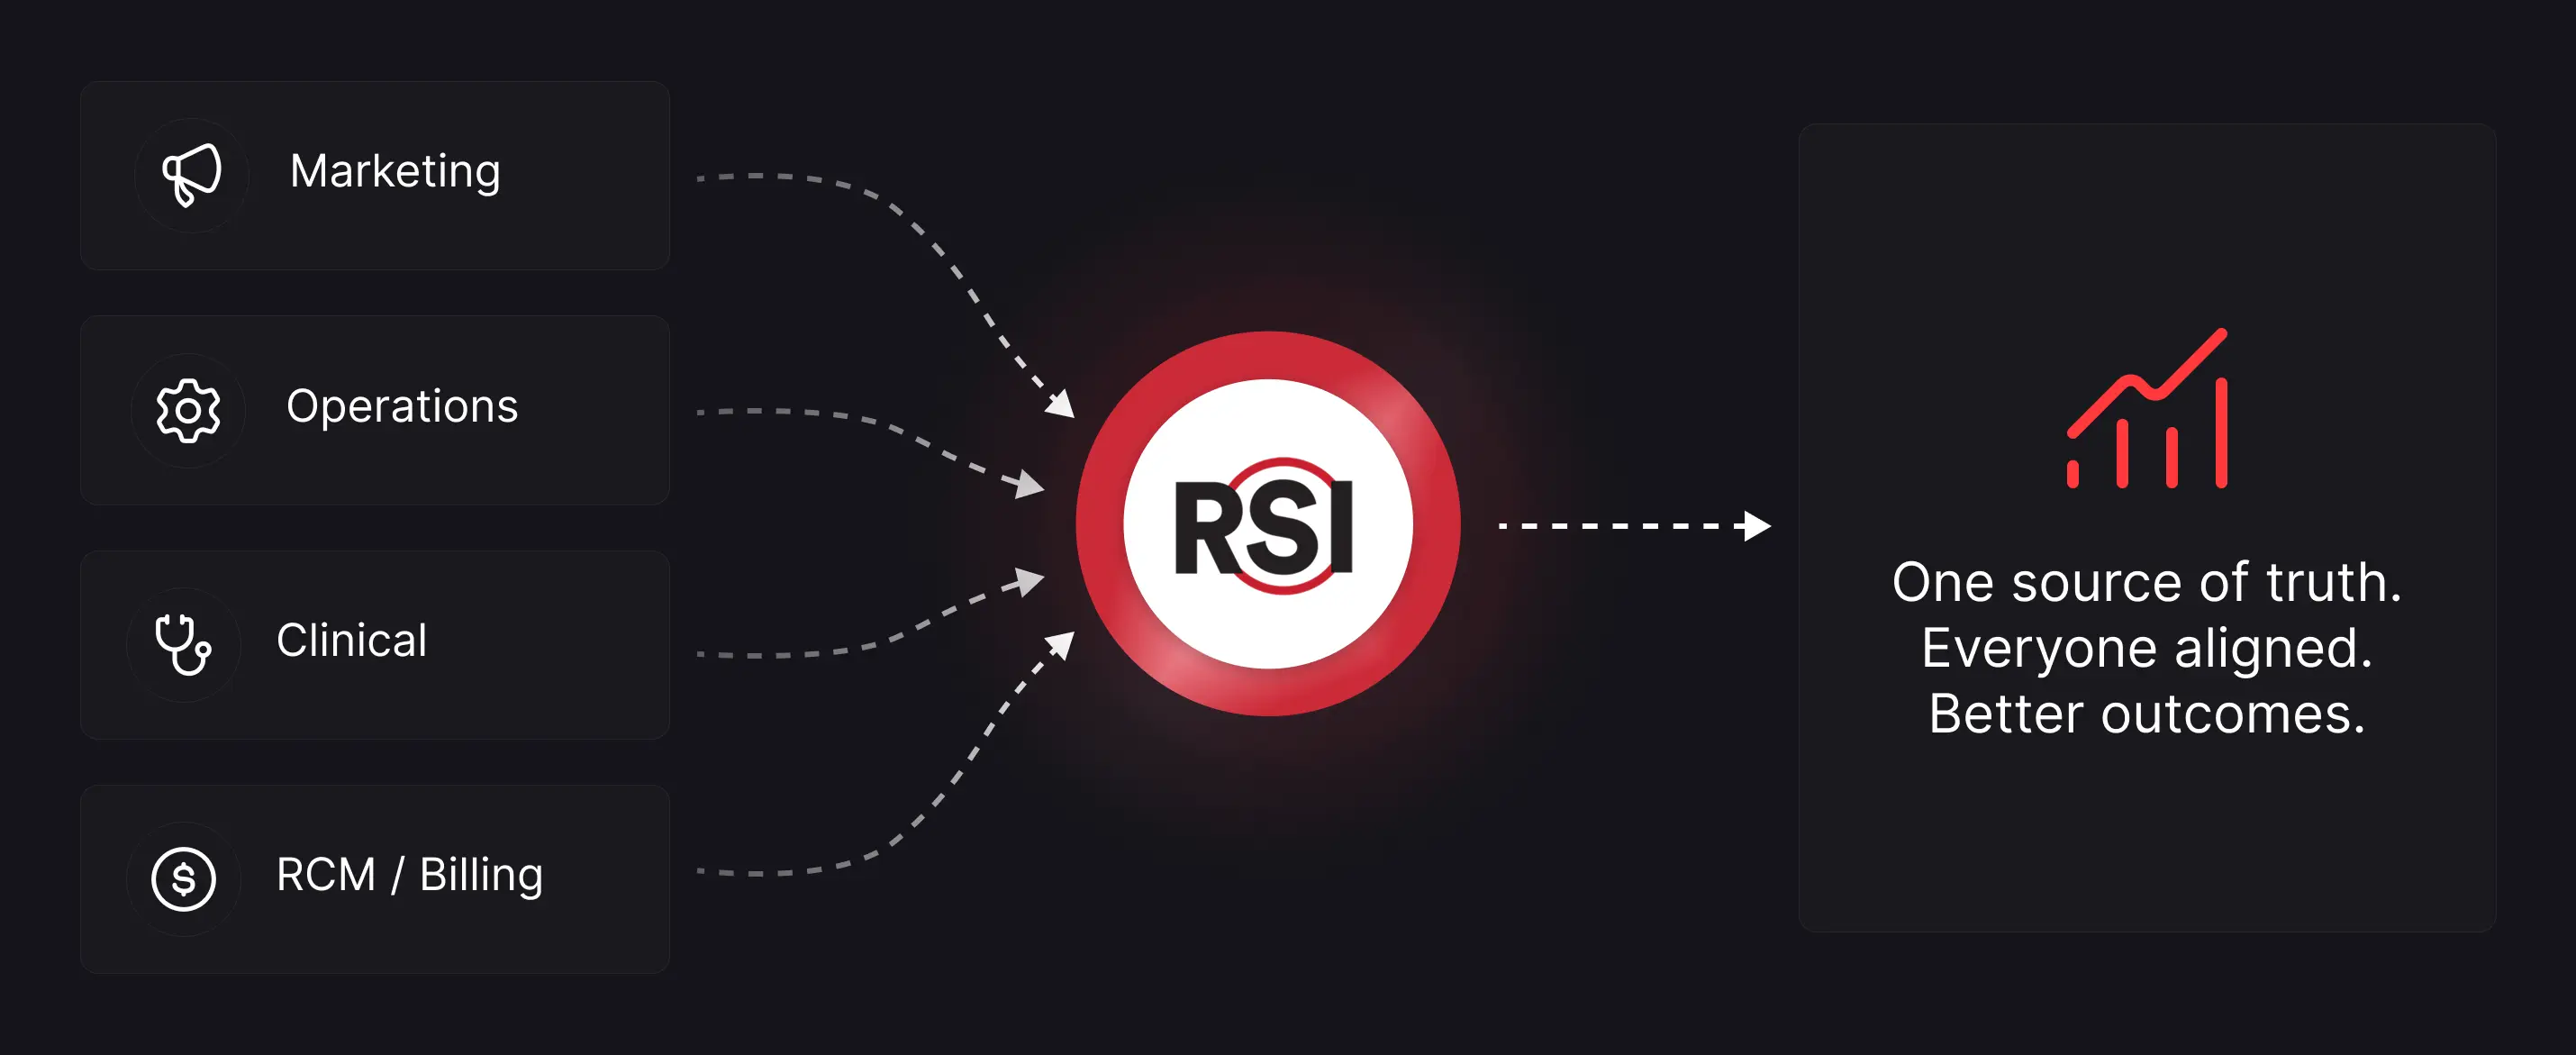
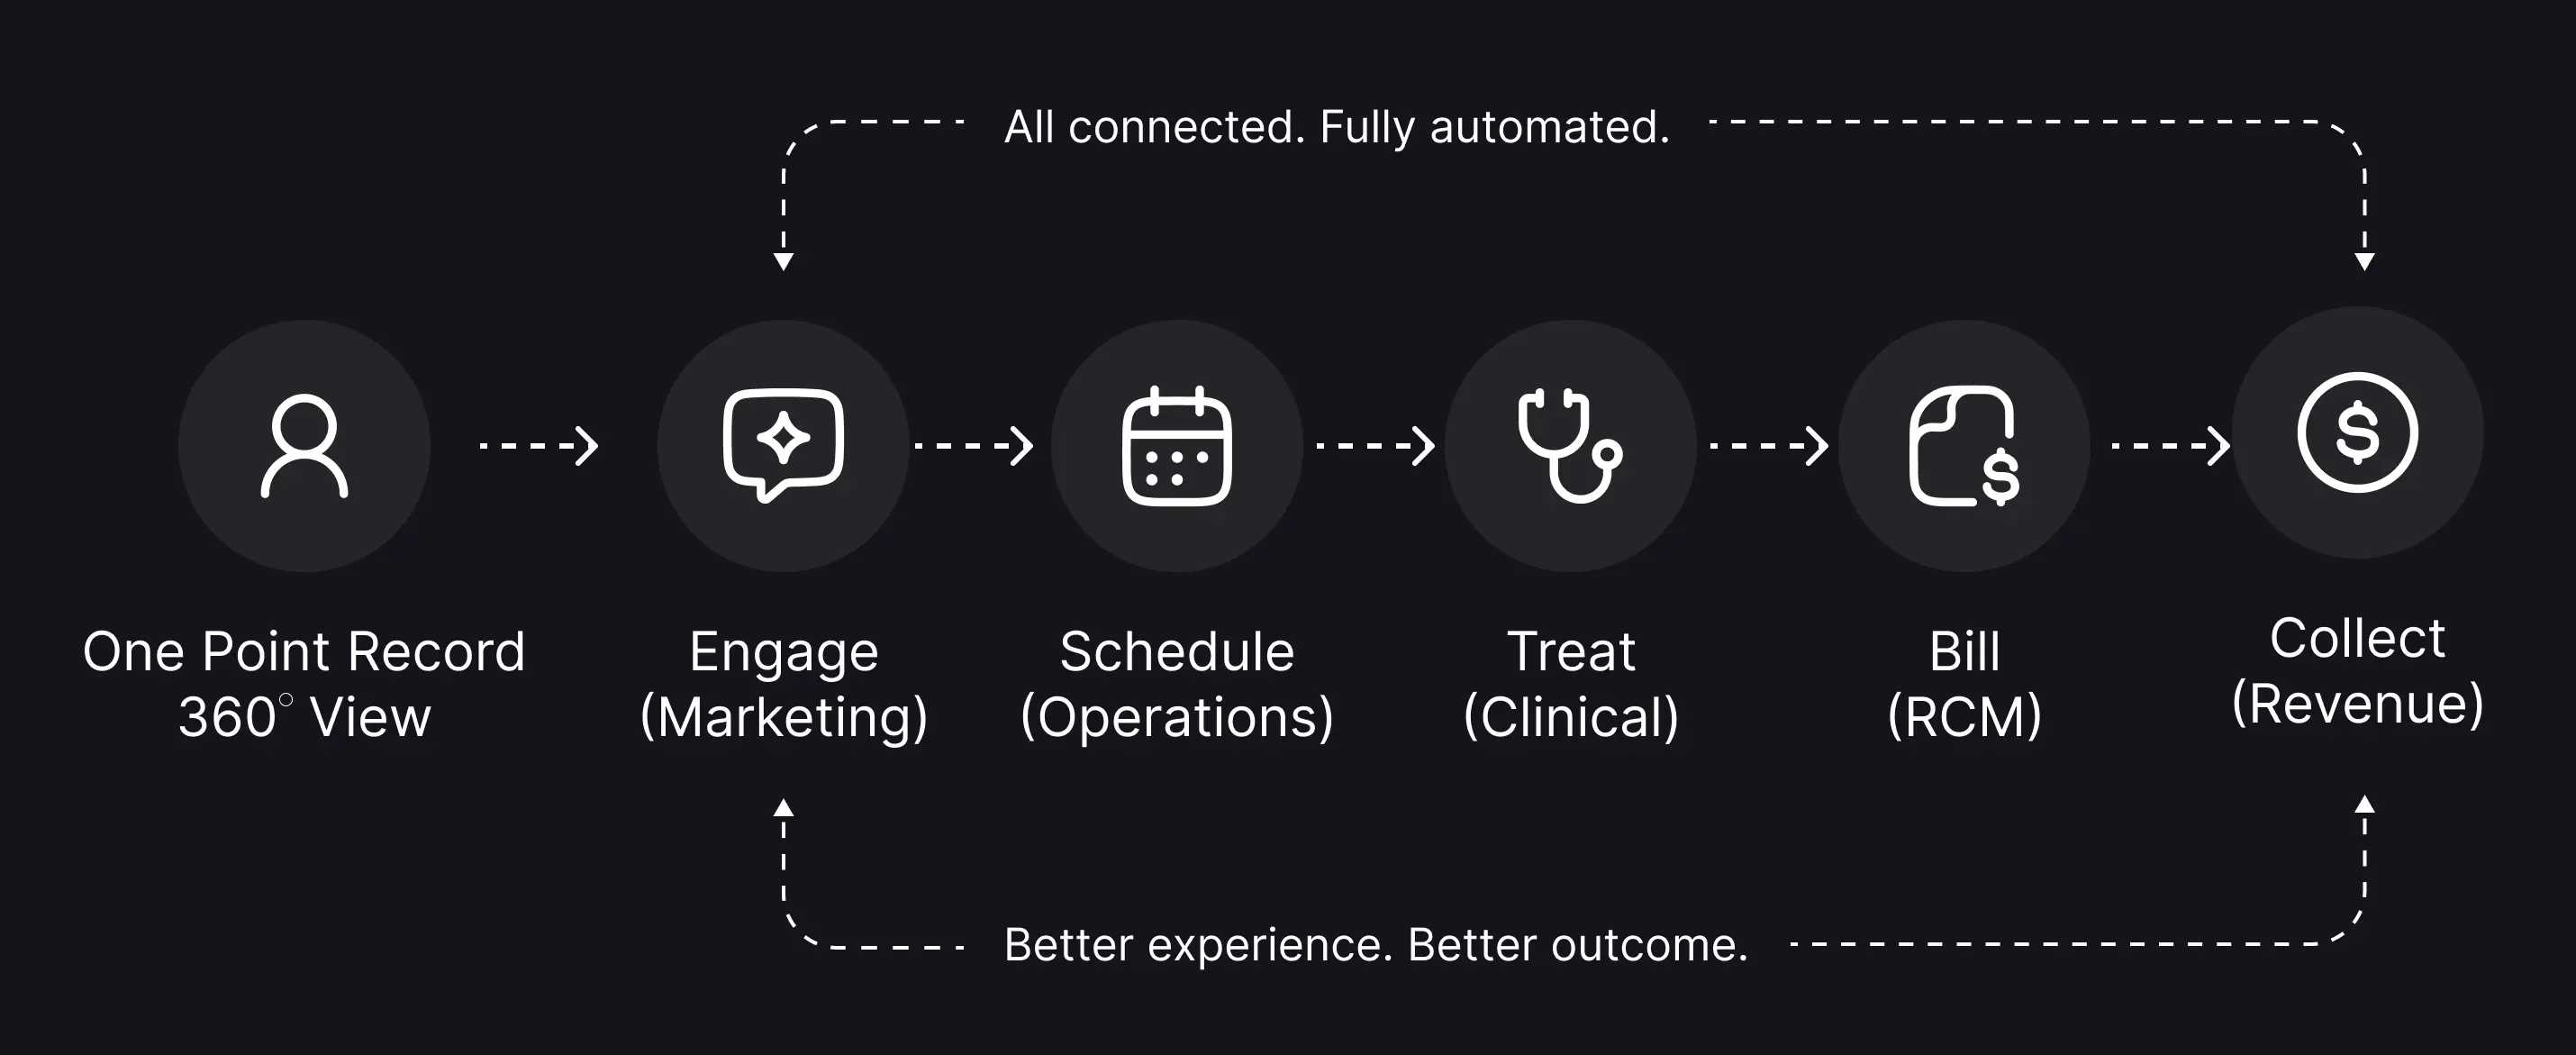
From disconnected decisions to connected practice intelligence

1

Create a single source of truth across your practice

Unify data from every department into one system

RSI platform unifying Marketing, Operations, Clinical, and RCM/Billing data into one source of truth for better outcomes.
2

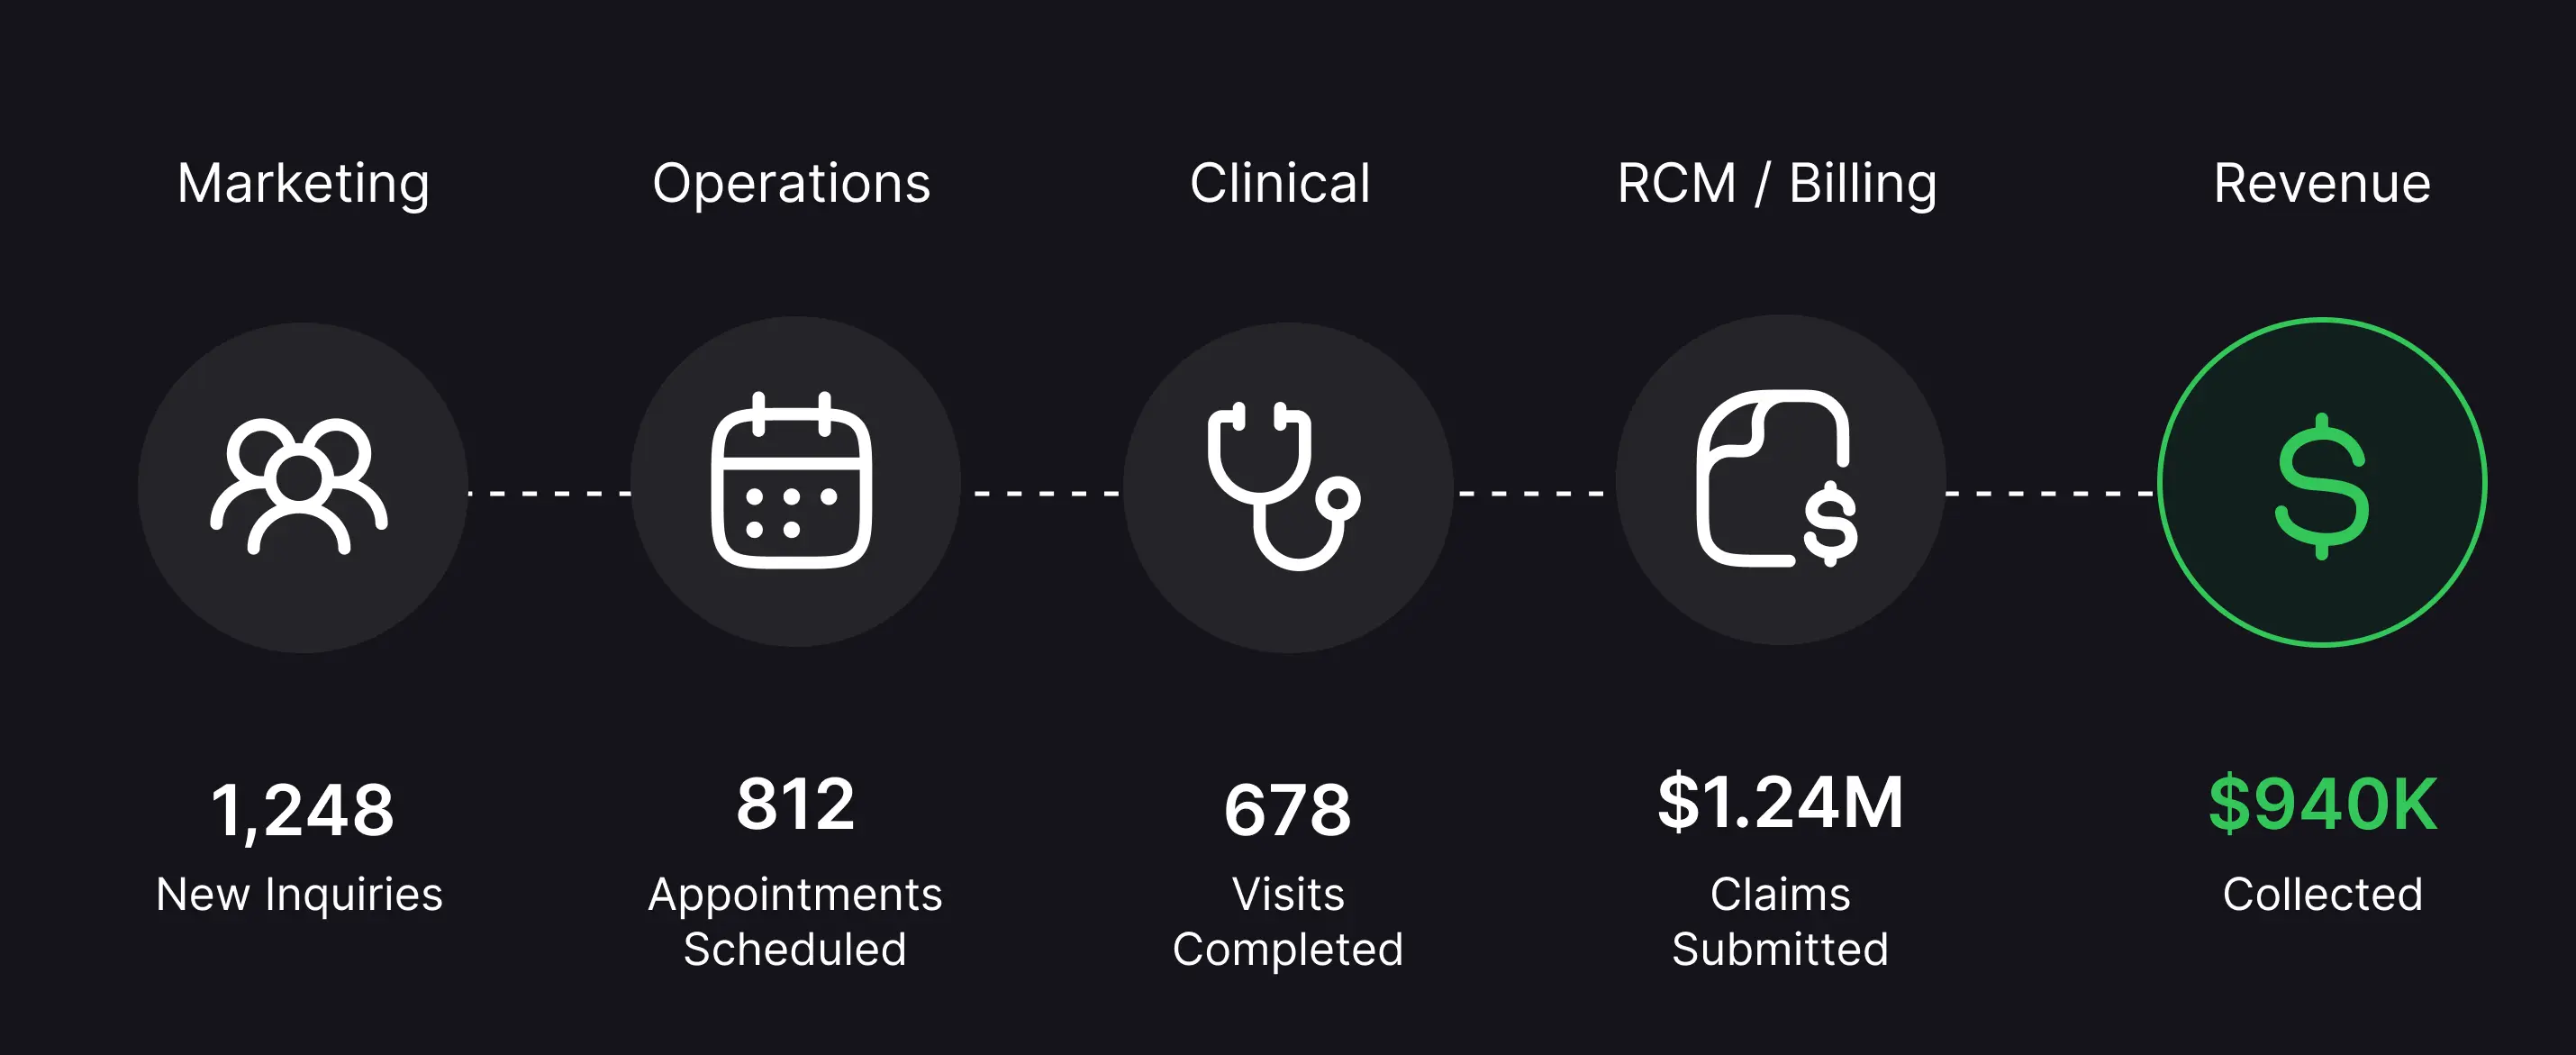
Connect KPIs across departments

See how marketing, operations, clinical, and RCM impact each

Cross-department performance pipeline from 1,248 marketing inquiries through operations, clinical, and billing to $940K collected.
3

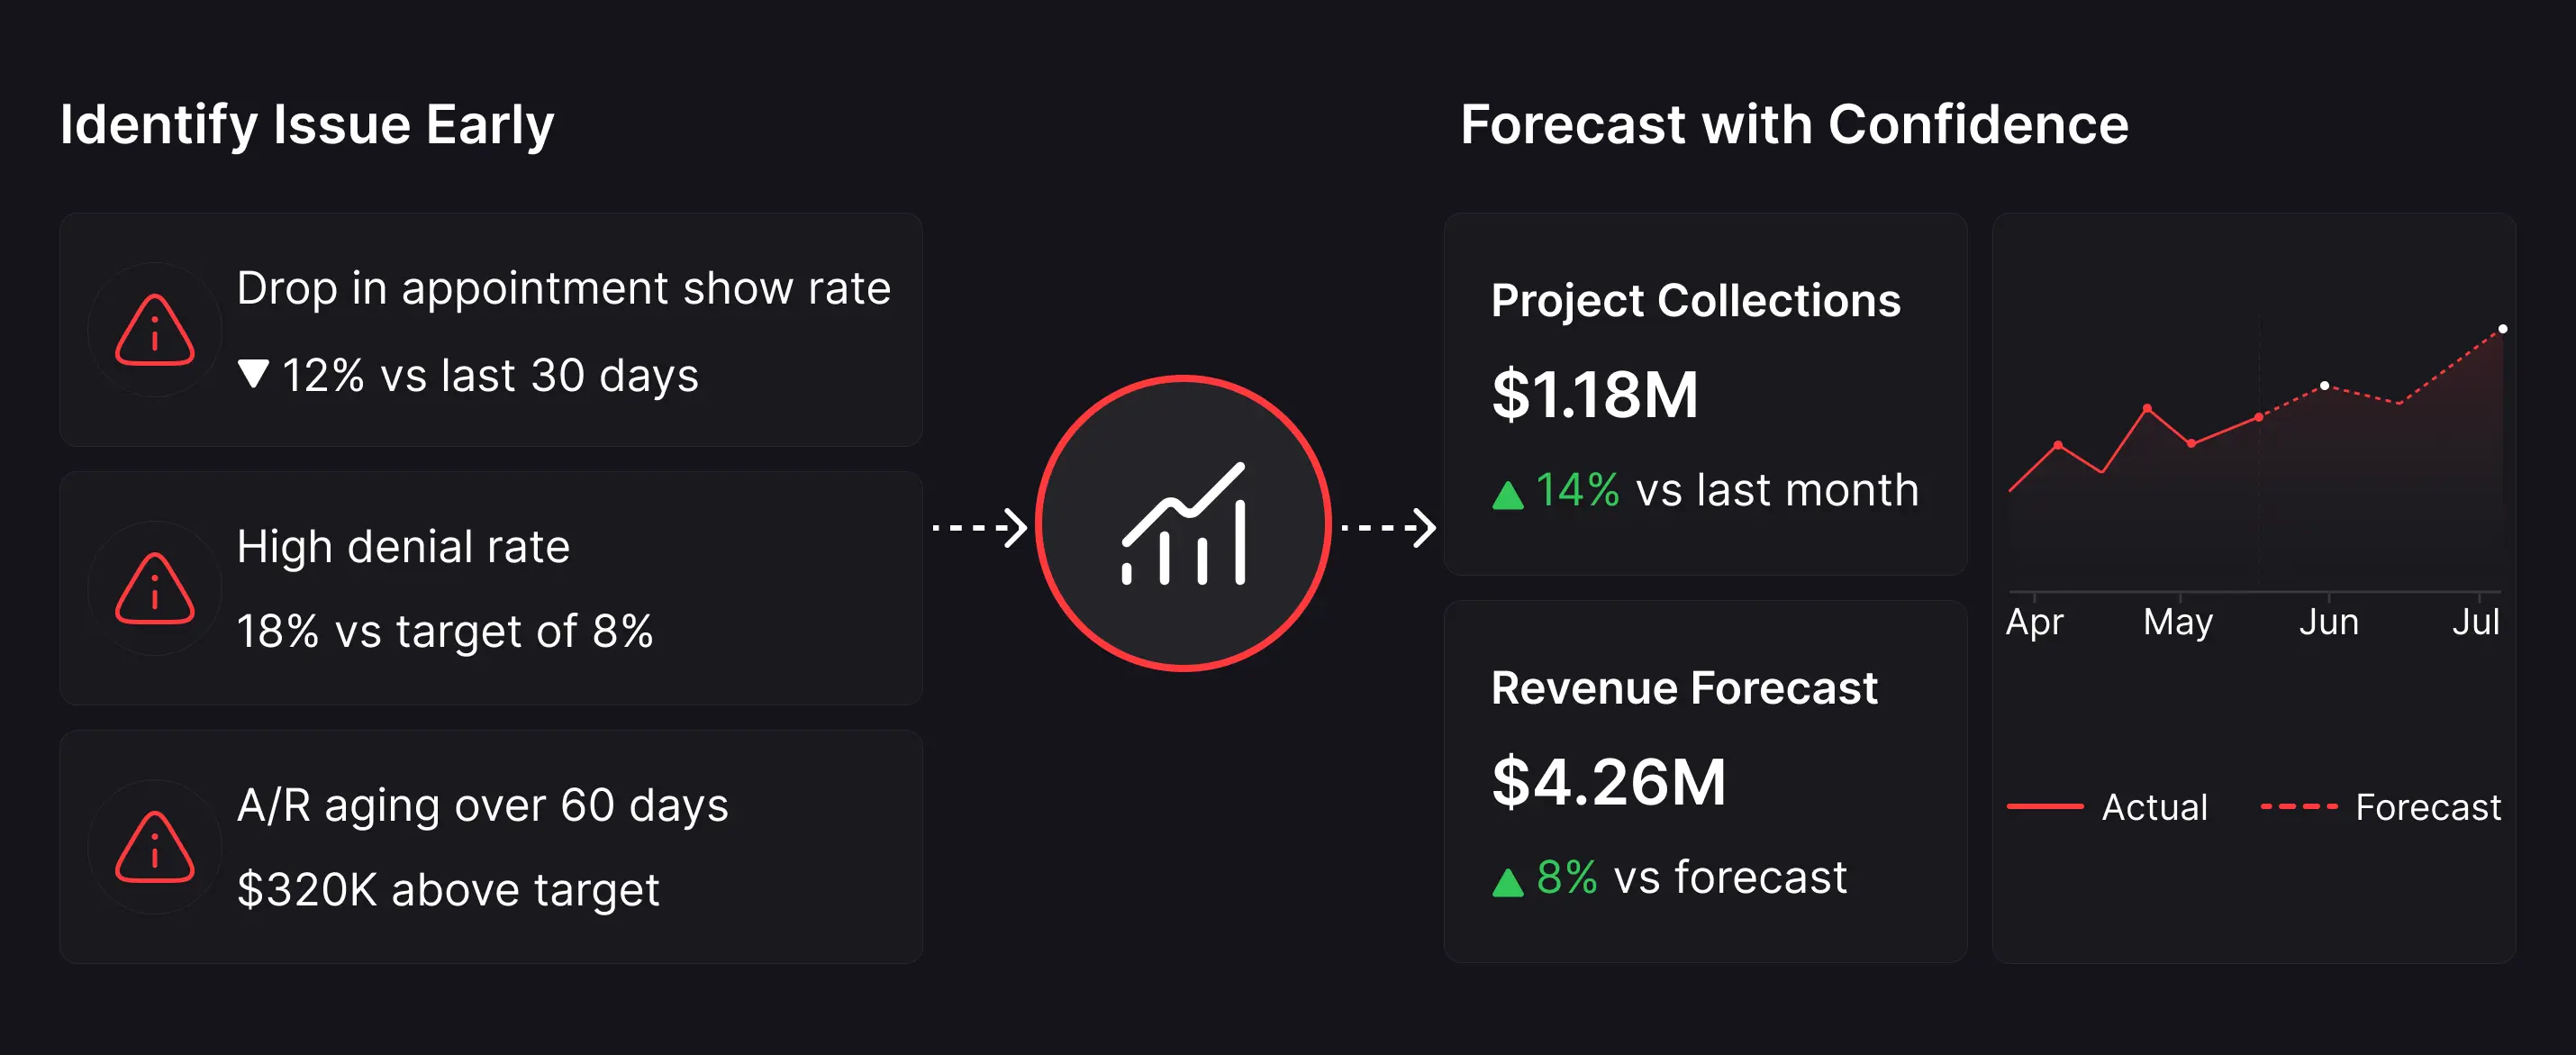
Move from reactive decisions to proactive strategy and forecasting

Use real-time data to identify issues and opportunities early with accurate forecasting

Early issue detection paired with revenue forecasting — flagging show rate drops and denial rates while projecting $4.26M revenue.
4

Optimize the patient journey from the same system

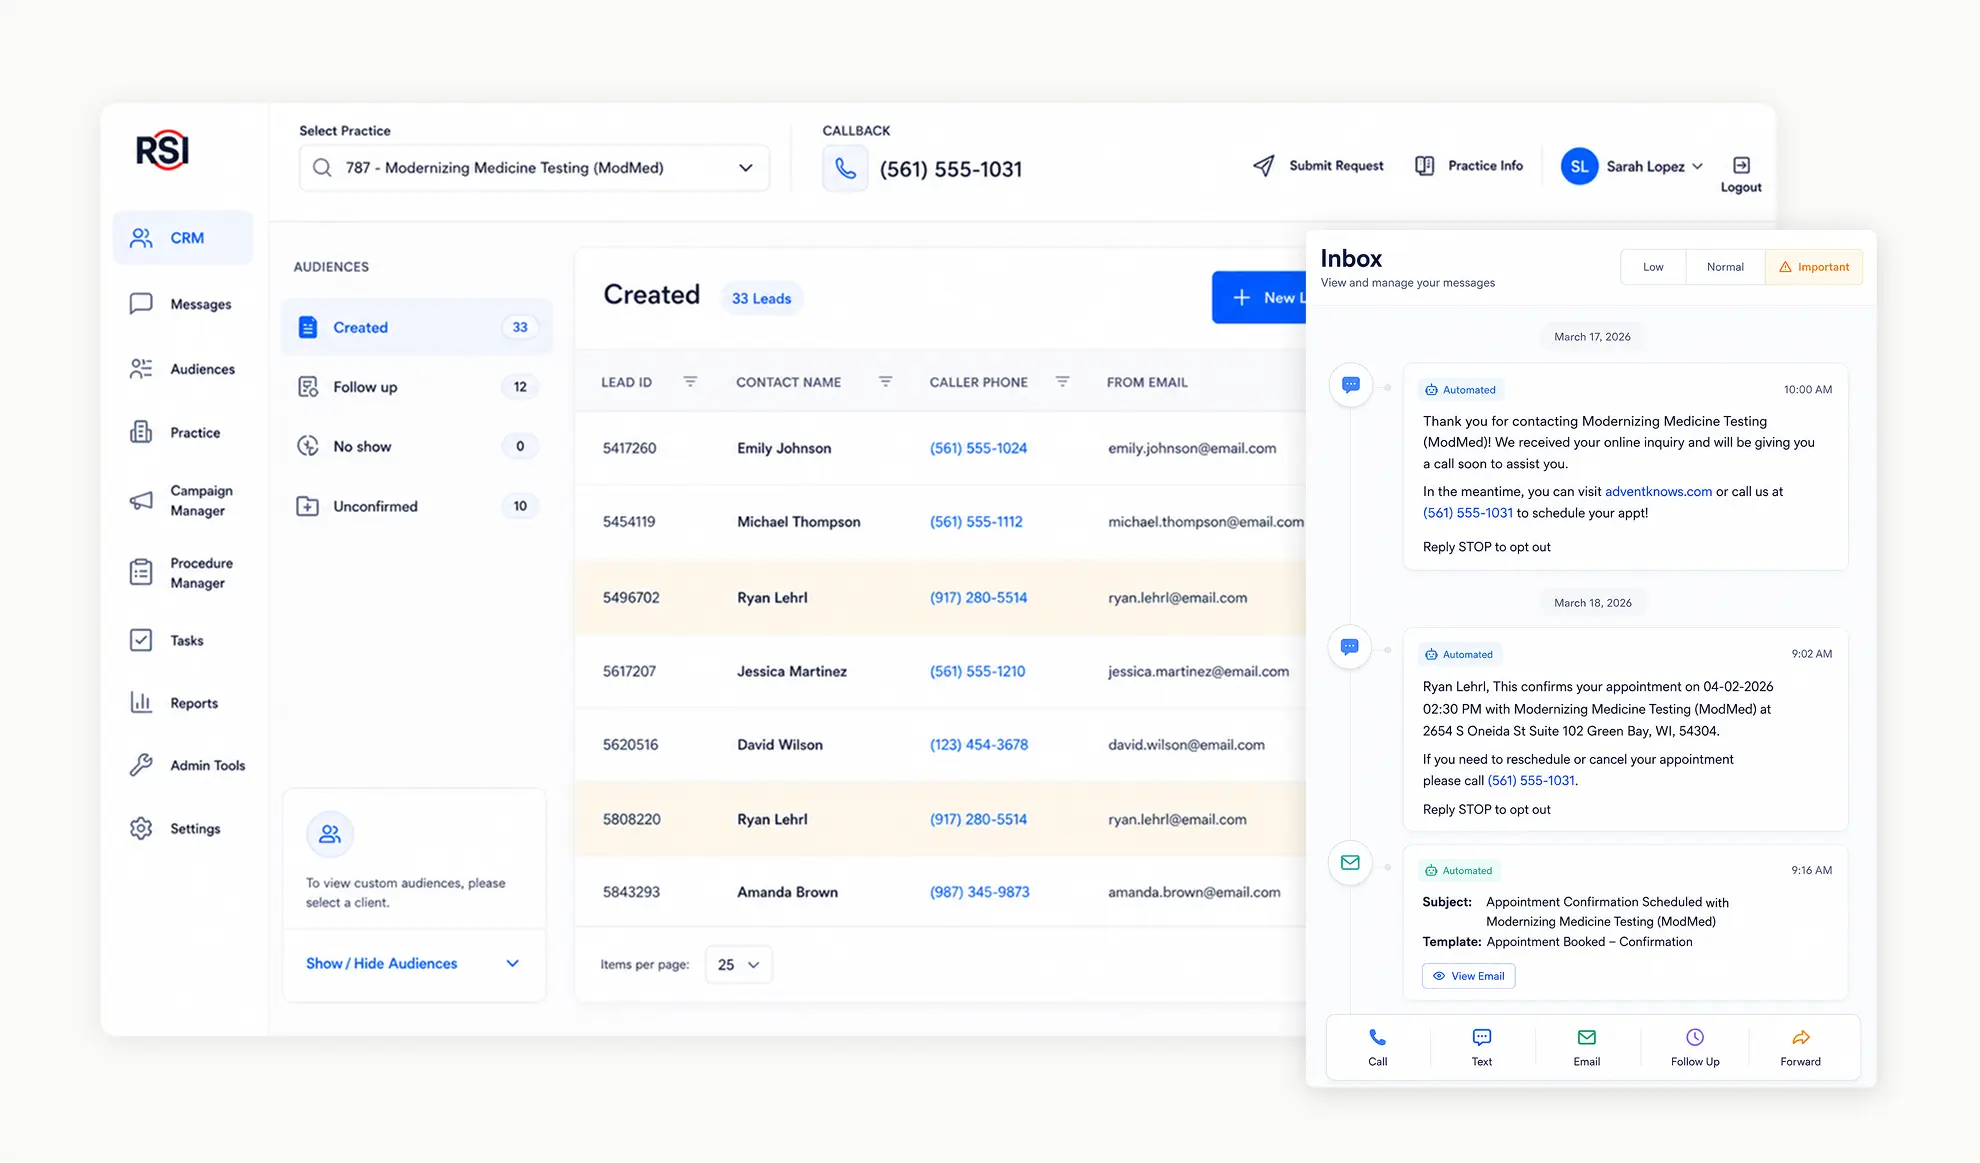
One patient record, all communication history, all your automation for every department

Connected patient journey from a single record through marketing, scheduling, clinical, billing, and revenue collection.
5

Reduce time spent on reporting

Access department connected dashboards instead of pulling data from multiple sources

Executive dashboard saving 10+ hours per week on reporting with real-time metrics across revenue, collections, visits, and net profit.
Key Features for RSI’s Physician Group Performance Management
04

Built for the leaders responsible for practice-wide performance

Four connected features that give your teams shared visibility, operational intelligence, and coordinated workflows across the entire practice.

Marketing channel distribution pie chart alongside lead-to-schedule breakdown across 13 channels totaling 441,267 leads.

Cross-department workflow integration & sync

Synchronize marketing, contact center, clinical, and RCM dependent workflows

Patient acquisition dashboard showing 66.8% lead-to-schedule rate, $1.05B billed, and leads trend compared to payments by channel.

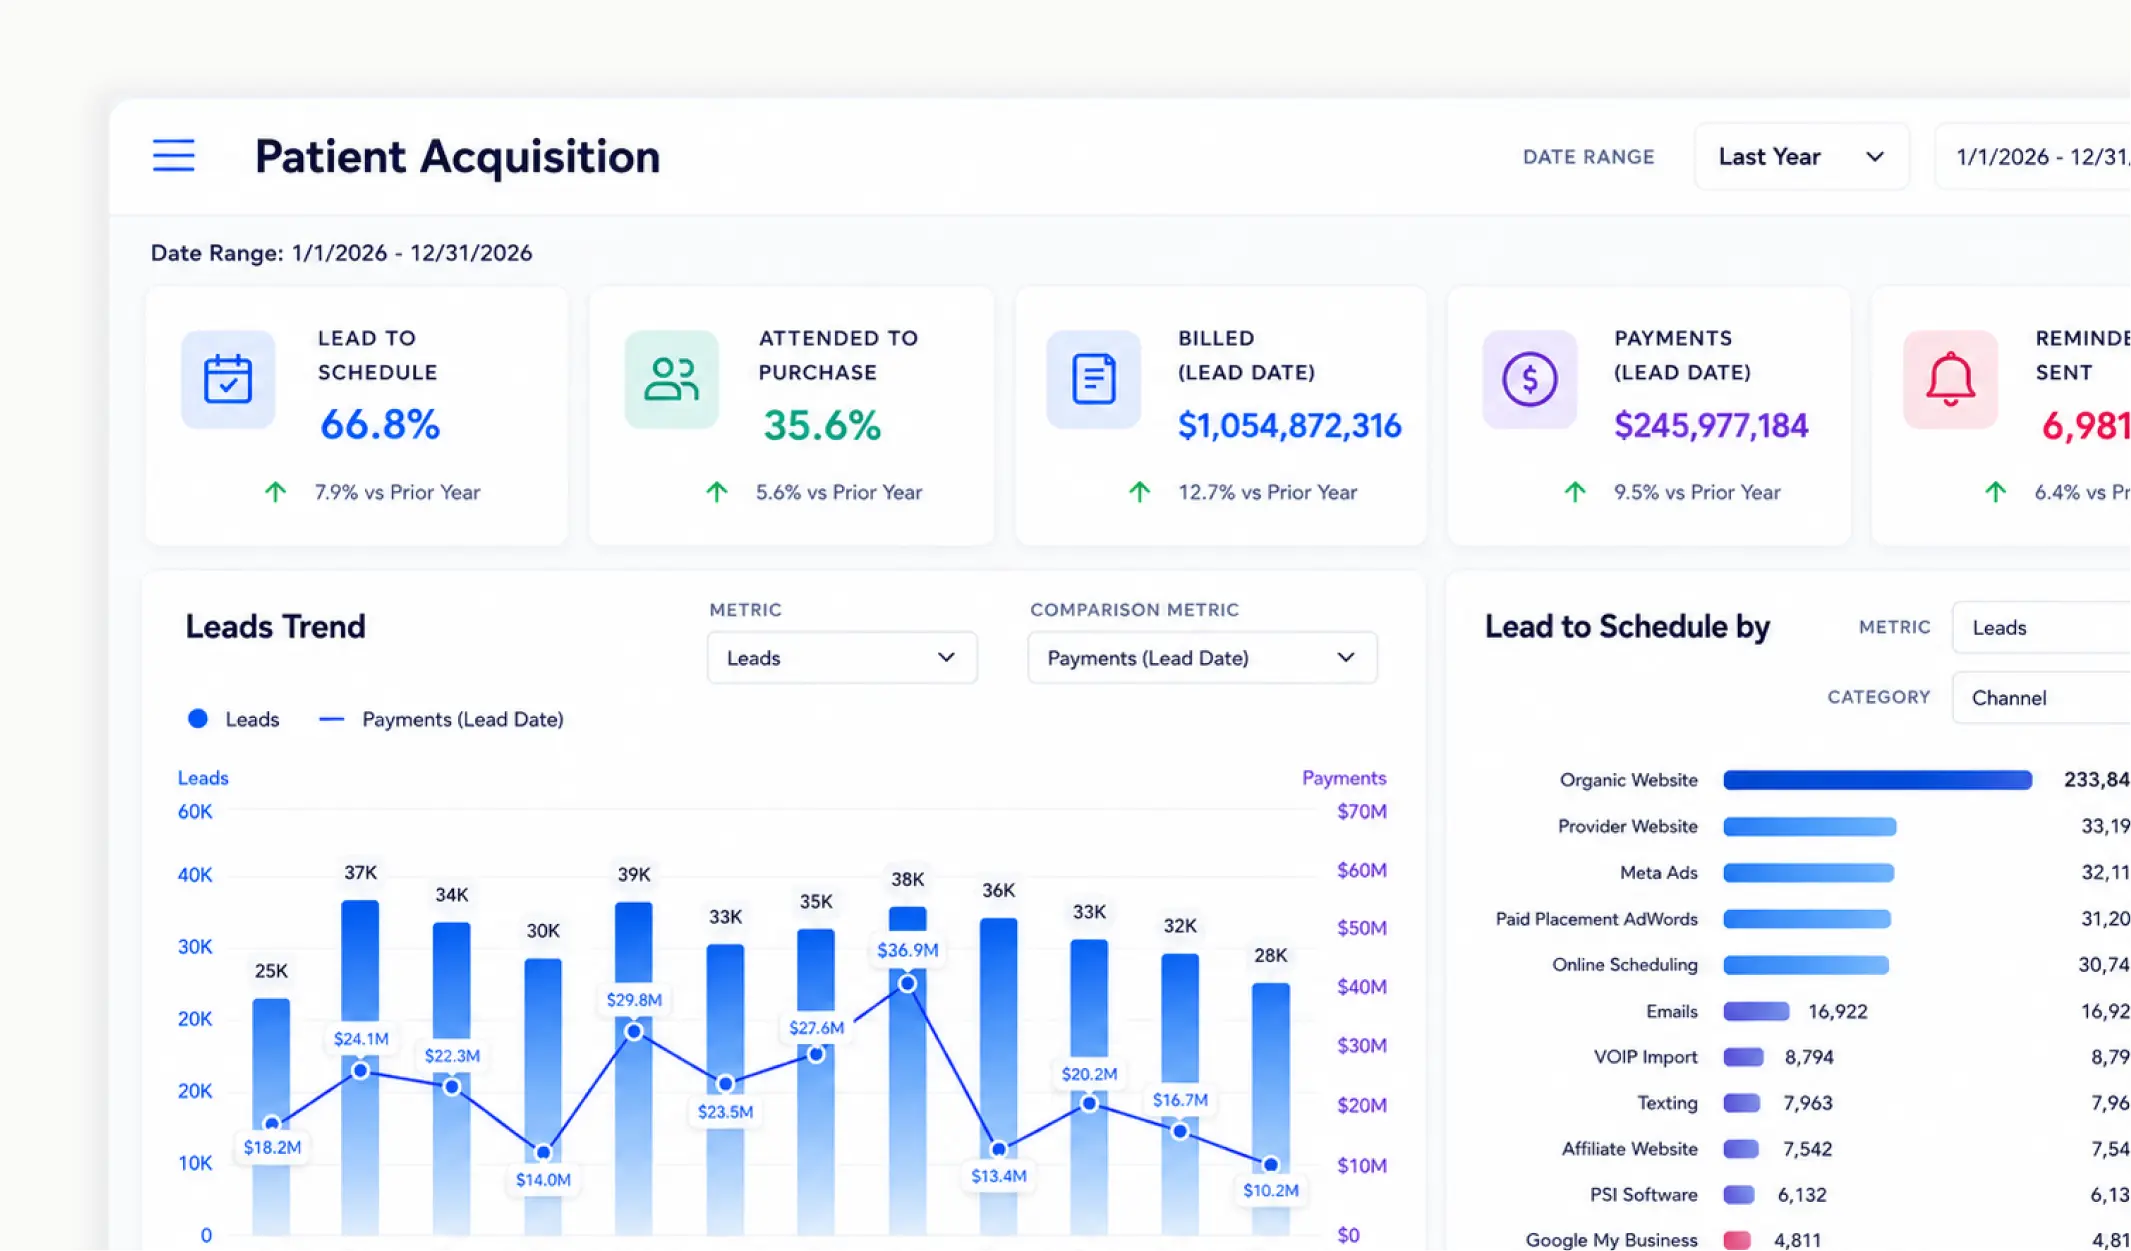
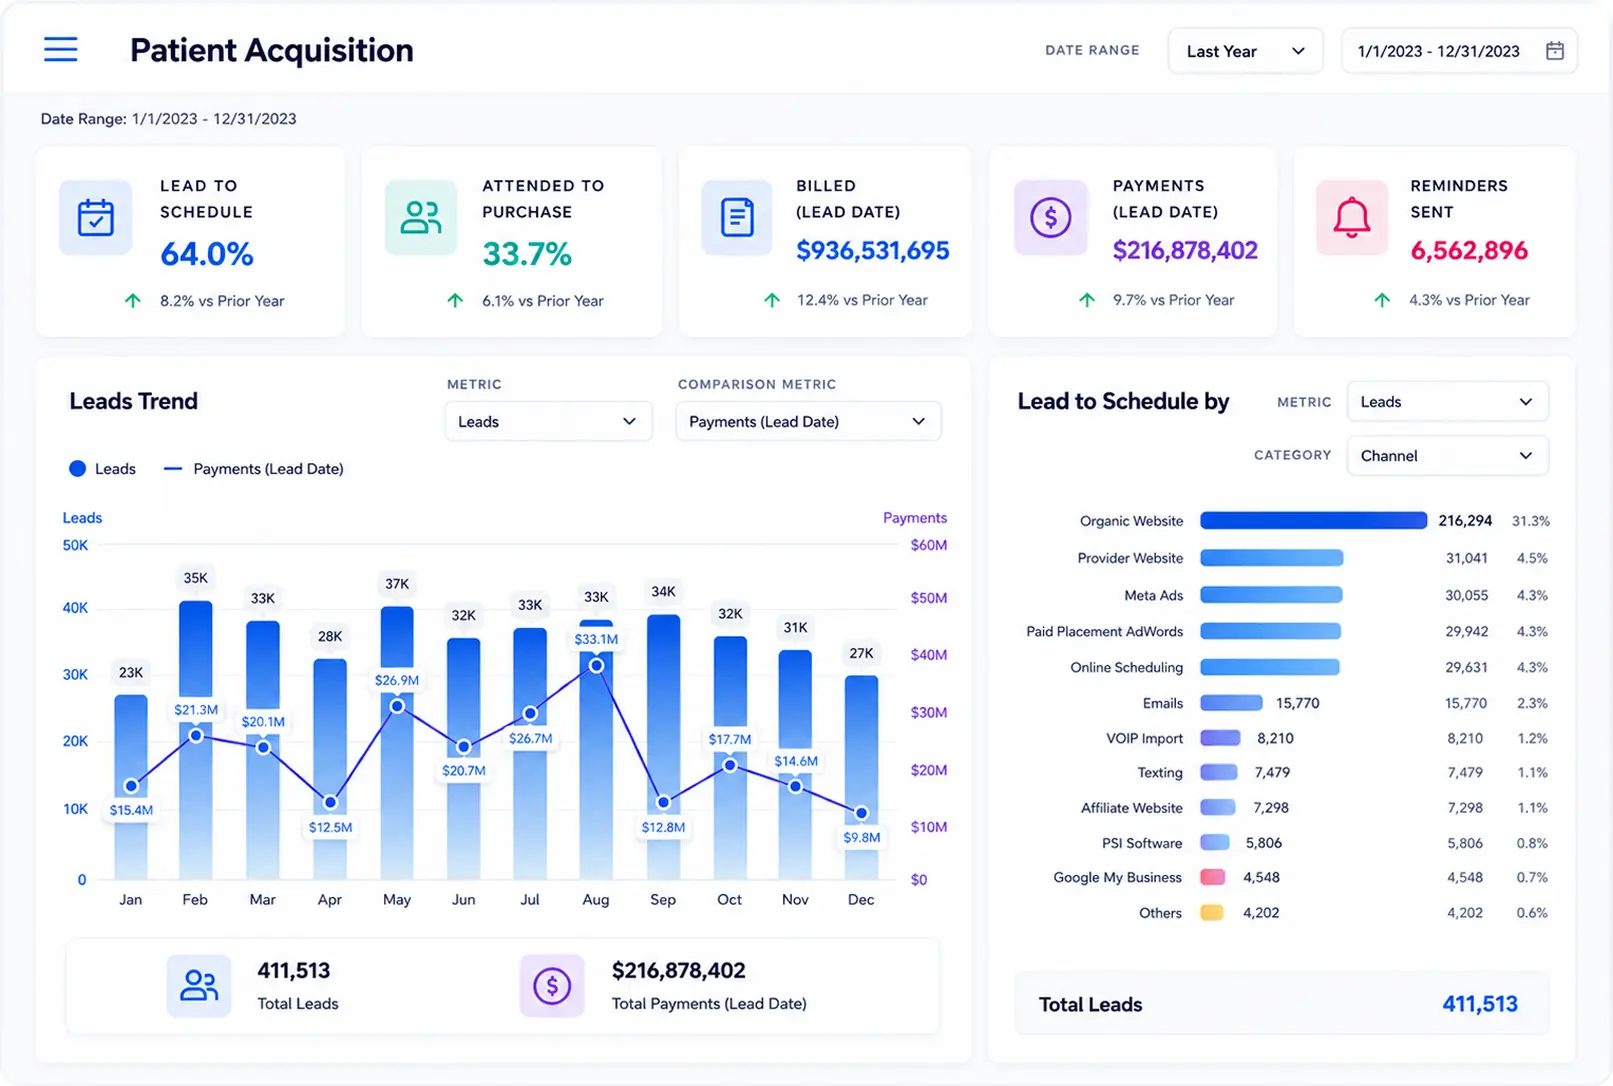
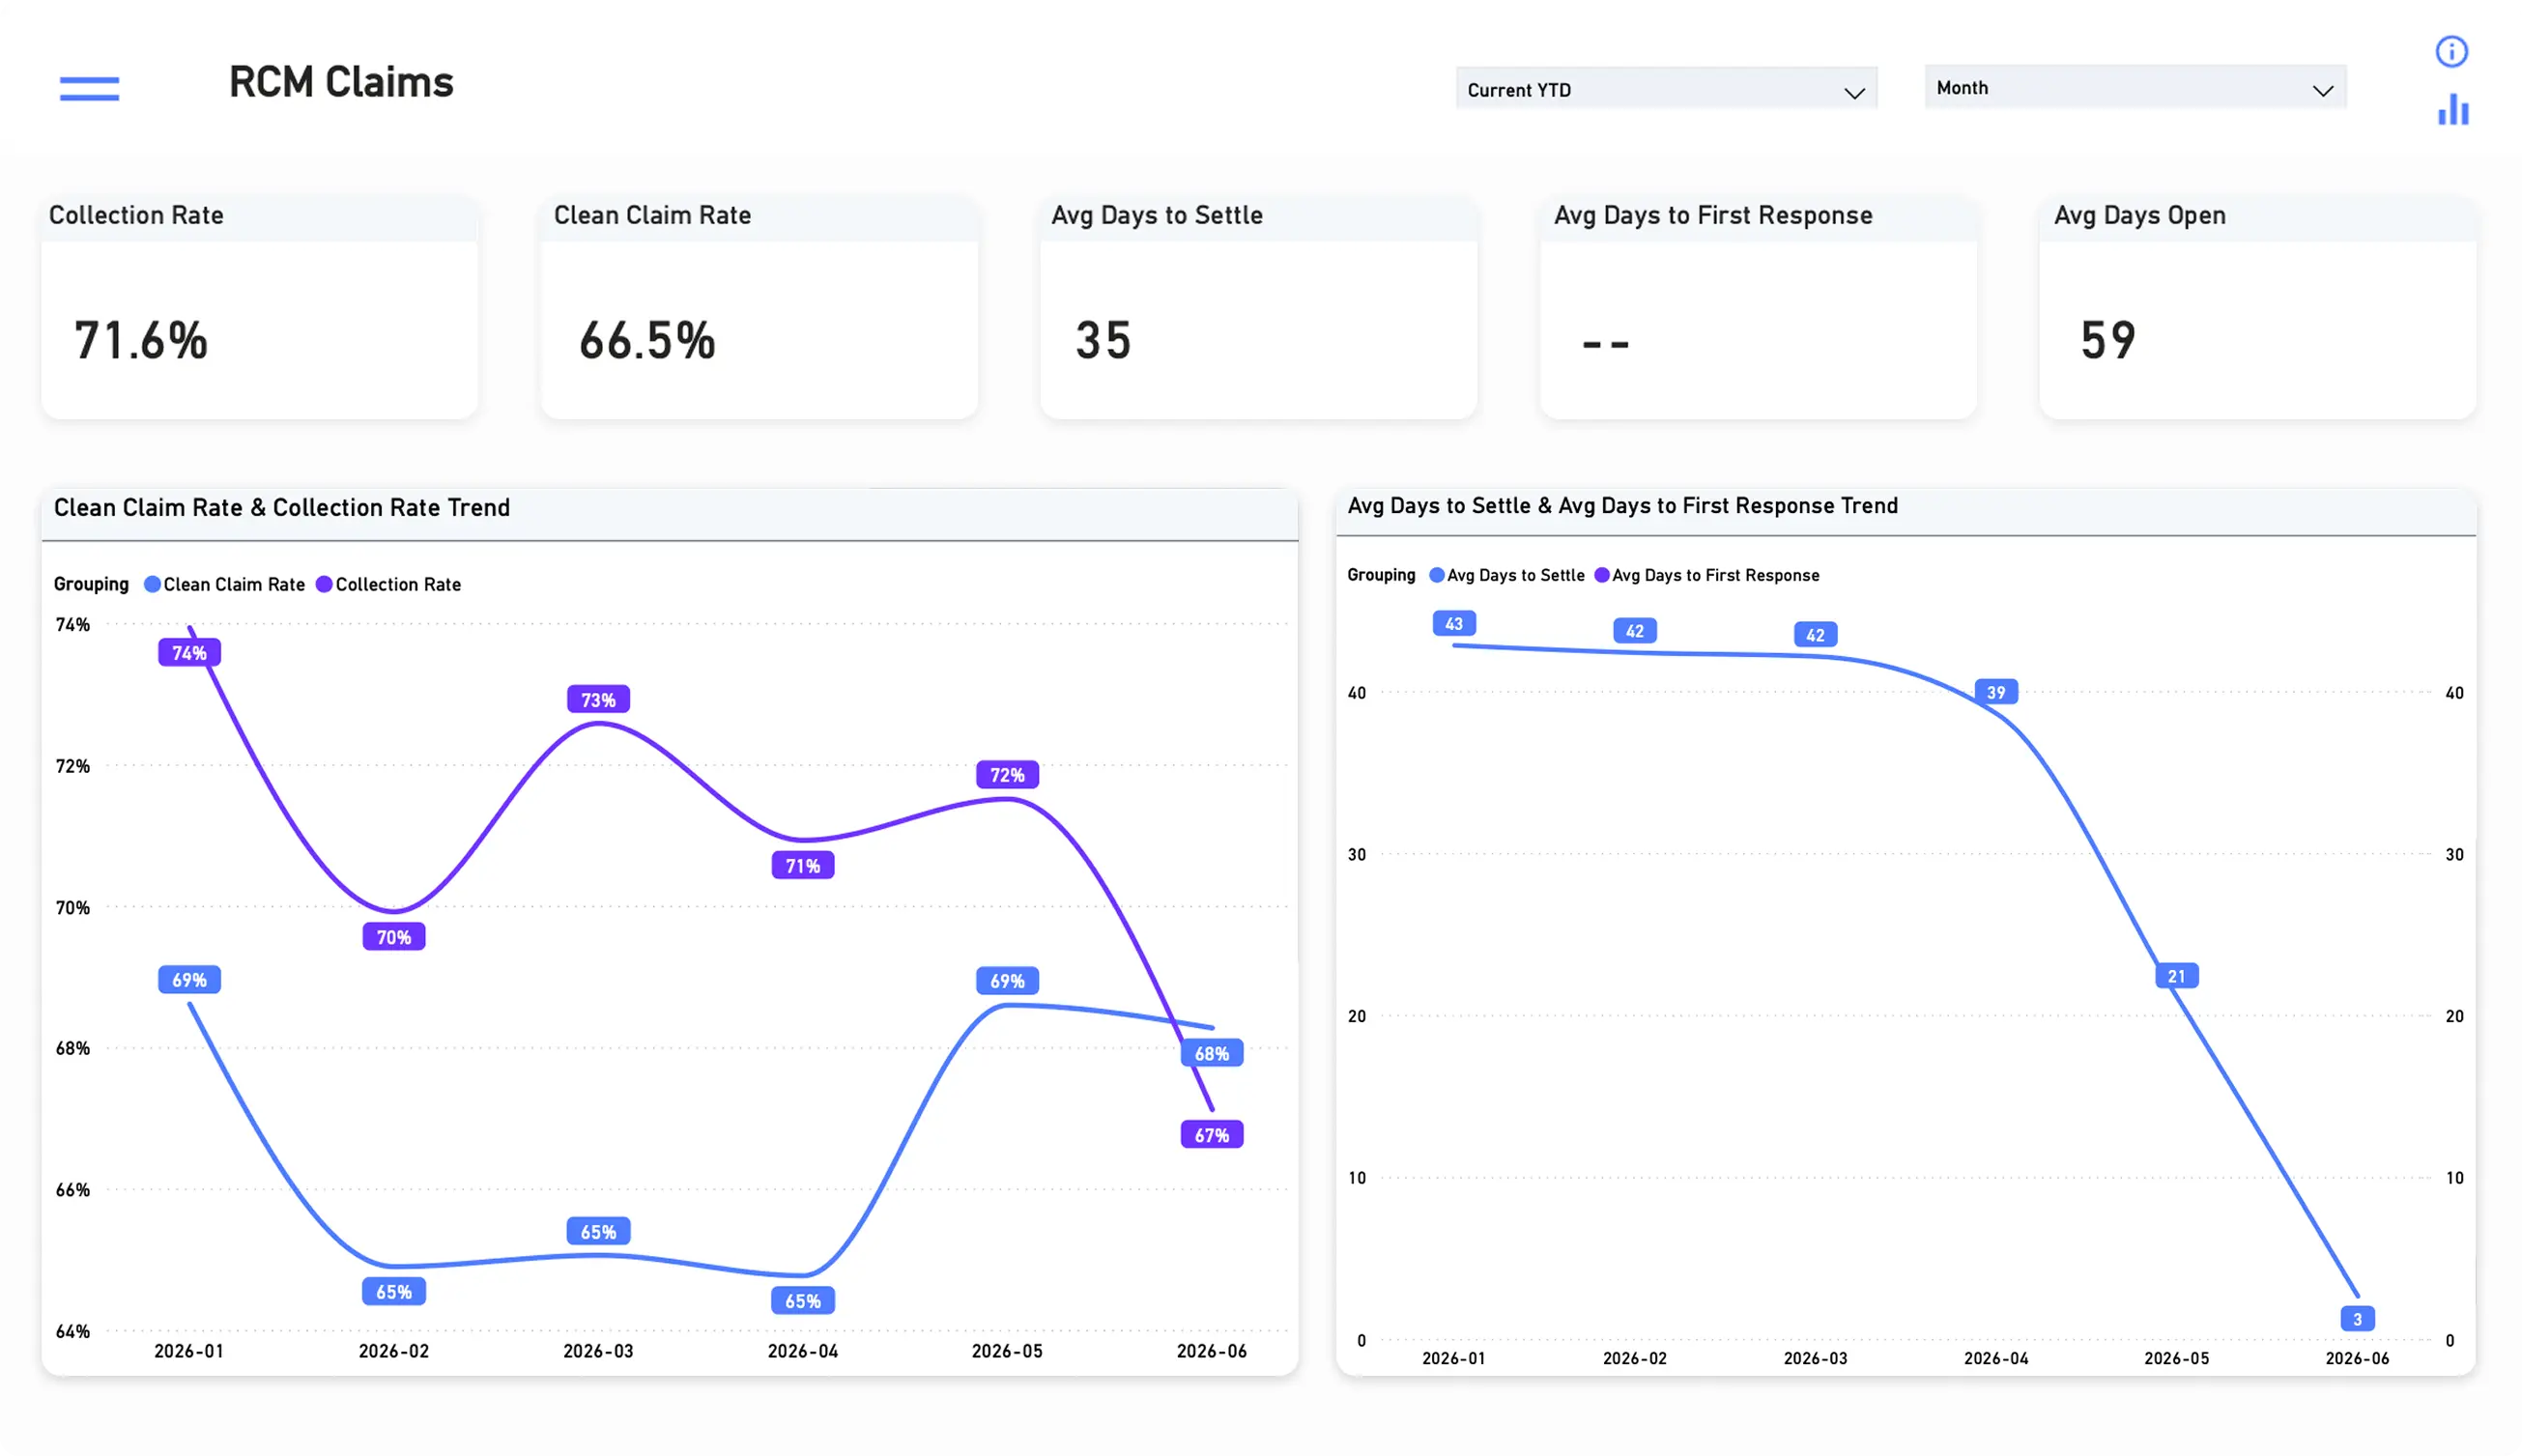
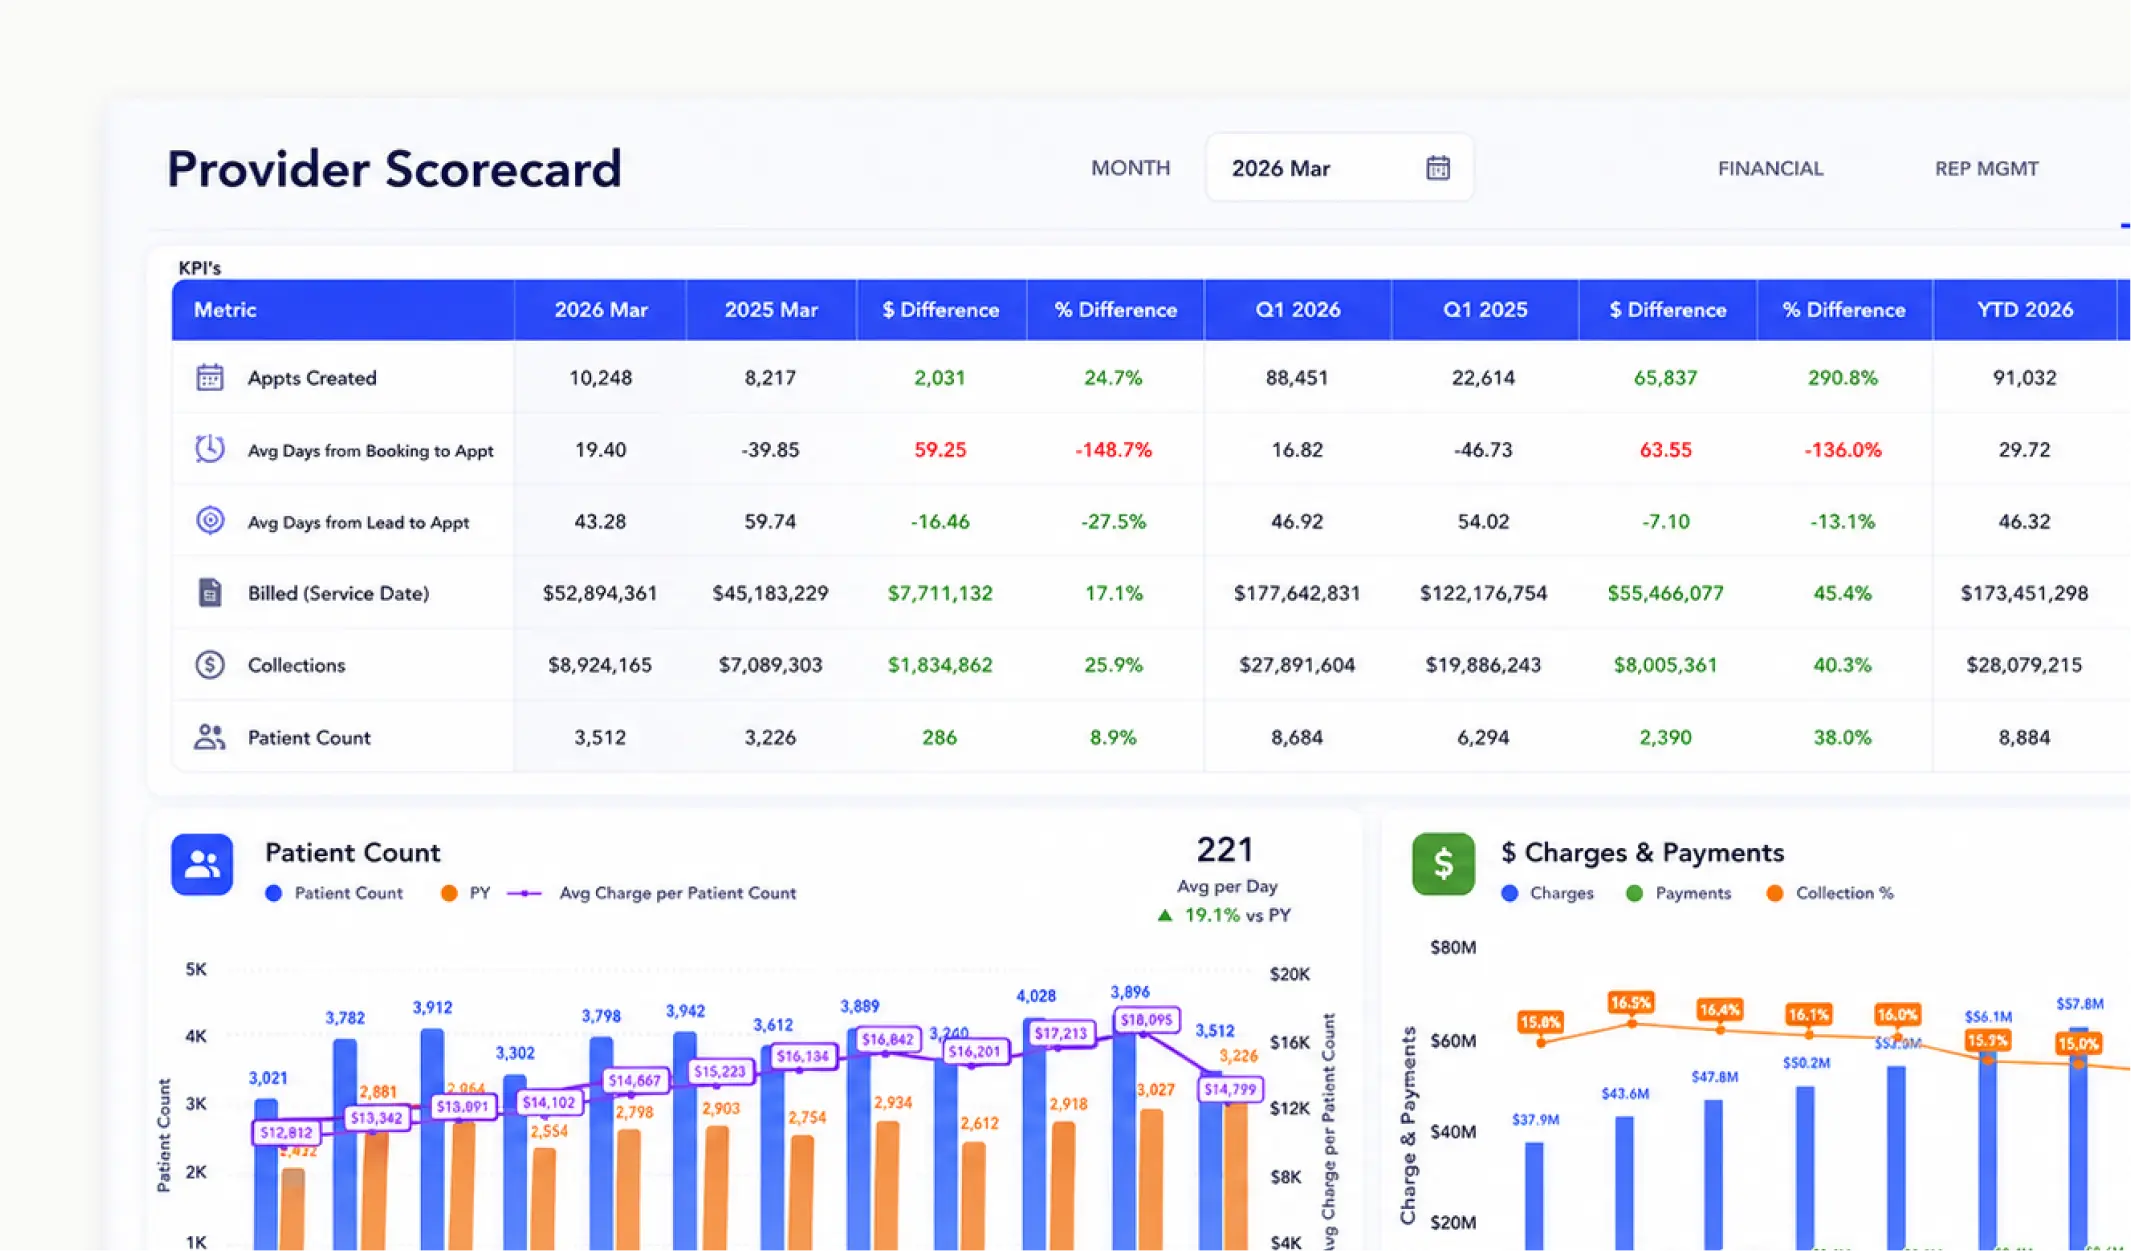
Unified practice performance dashboards

See real-time performance across your entire practice in one place

Provider scorecard comparing appointments, billing, collections, and patient count month over month and year to date.

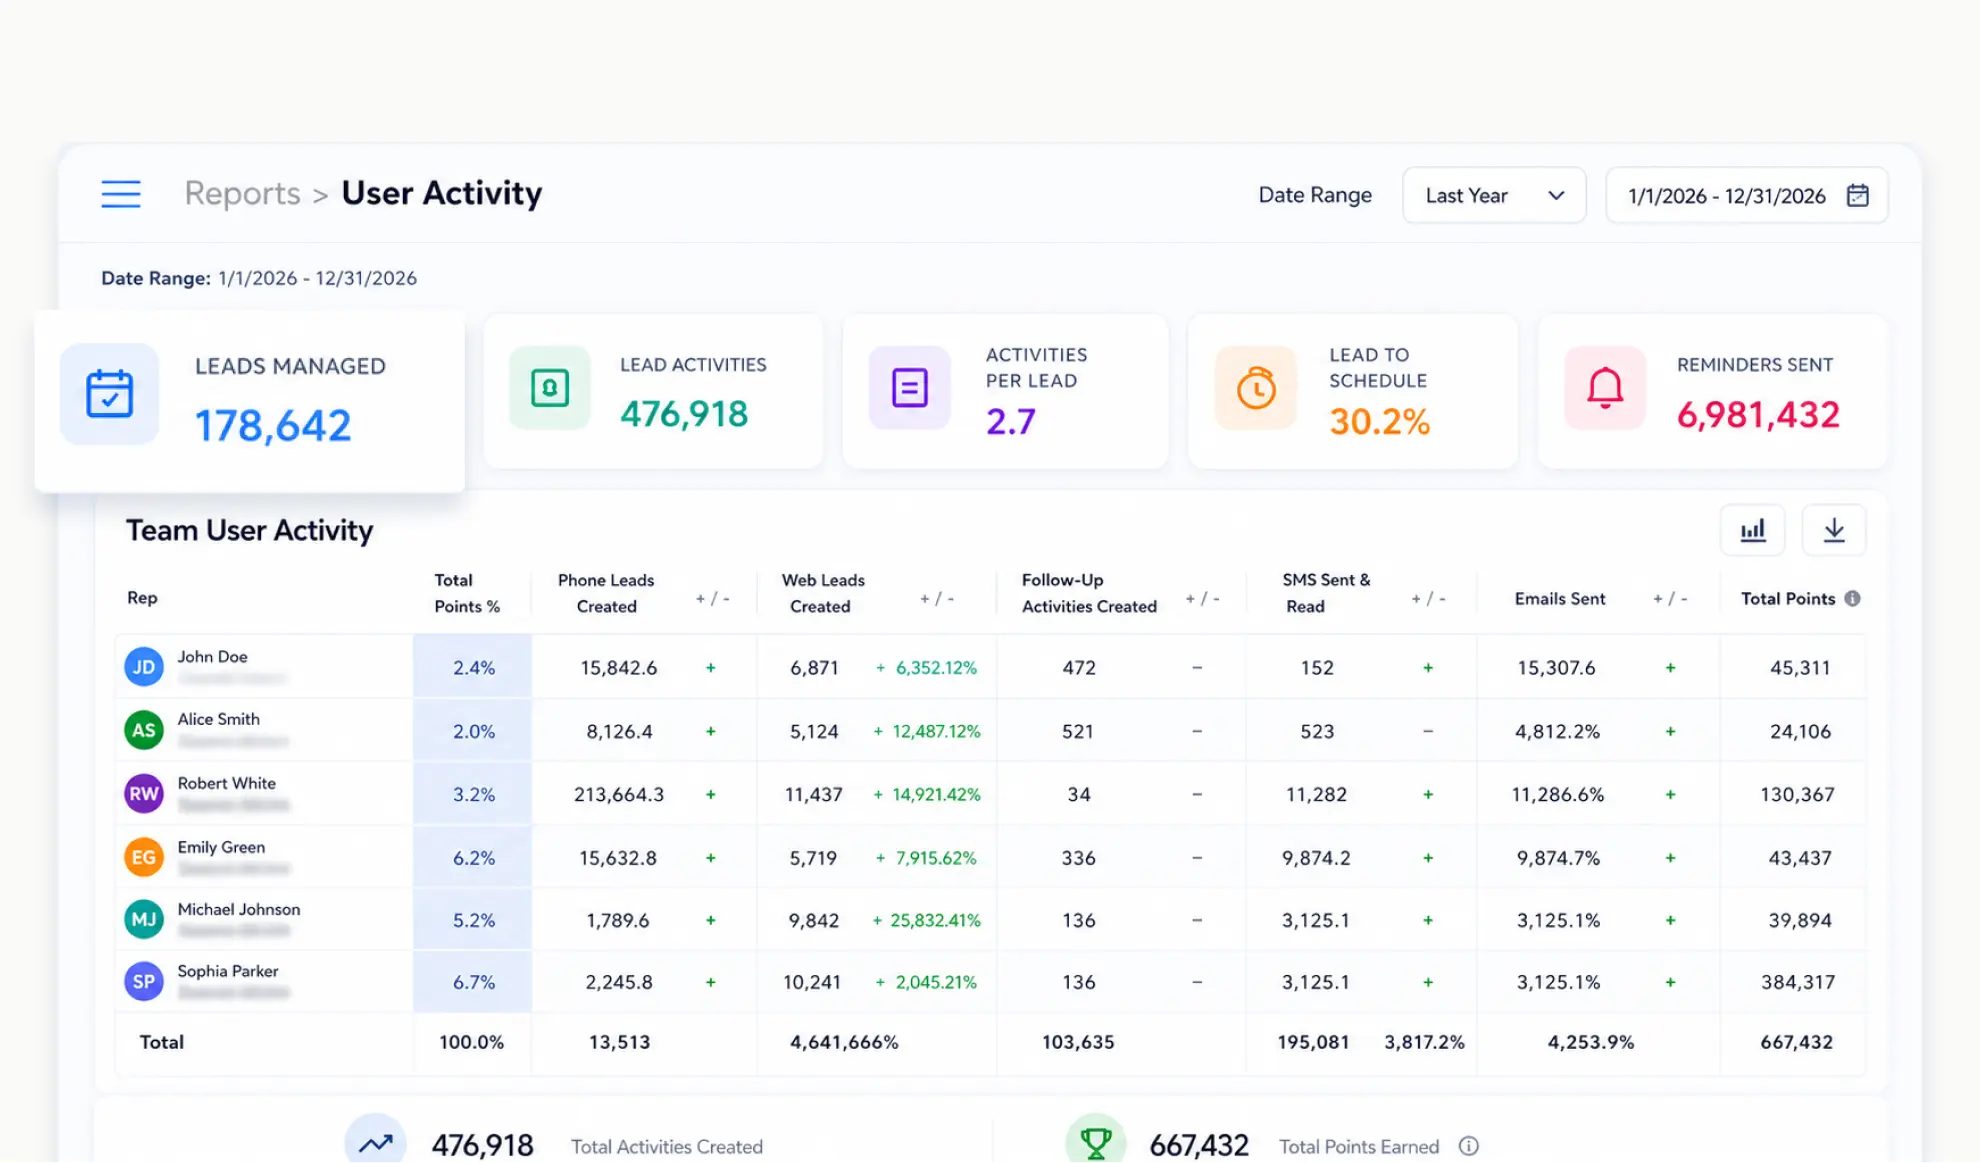
Cross-department KPI intelligence

Understand how each team contributes to overall outcomes

Patient general report with reminder send rates alongside daily appointment schedule and 90% patient confirmation rate.

Real-time practice intelligence

Monitor what’s happening across locations, teams, and workflows

Outcome
05

The results your entire practice will actually feel

One unified view of performance across every department, so nothing falls through the cracks.

75%
LESS REPORTING TIME
0
Zero patient leakage.
FAQs
06

Got questions? We're here to assist

Q1: What is a specialty practice management platform?

Q2: How does RSI differ from standard practice management software?

Q3: Can RSI support a multi-location specialty group or MSO structure?

Q4: How quickly do executives see ROI from RSI?

Q5: Why do specialty practice executives struggle with visibility across departments?

Q6: What causes revenue leakage in specialty medical practices?

Q7: What is a medical practice executive dashboard?

Q8: How does RSI reduce reporting time for healthcare executives?

Q9: Can RSI support multi-location physician groups and MSOs?

Q10: Can RSI work with our existing practice management and phone systems?

Q11: How does RSI support patient revenue attribution and forecasting?

Q12: How does RSI support a stronger physician group data strategy?

See what’s driving performance across your practice and how to improve it

Connect operational, clinical, and revenue data in one system so your teams can make faster, more confident decisions.

RSI lead trend dashboard