RSI Brand logo
Who We Serve

See how every department impacts your revenue

From marketing, patient scheduling, to clinical care and RCM, every team plays a rold in how revenue is created, captured, or lost.  RSI connects every department with shared visibility and unified automation.

Referring Provider Dashboard
Consumer Messages
Patient Relationship Dashboard
Workflows
Why It Matters
02
RSI Brand logo

One Platform. Every Department. One Connected Patient Journey.

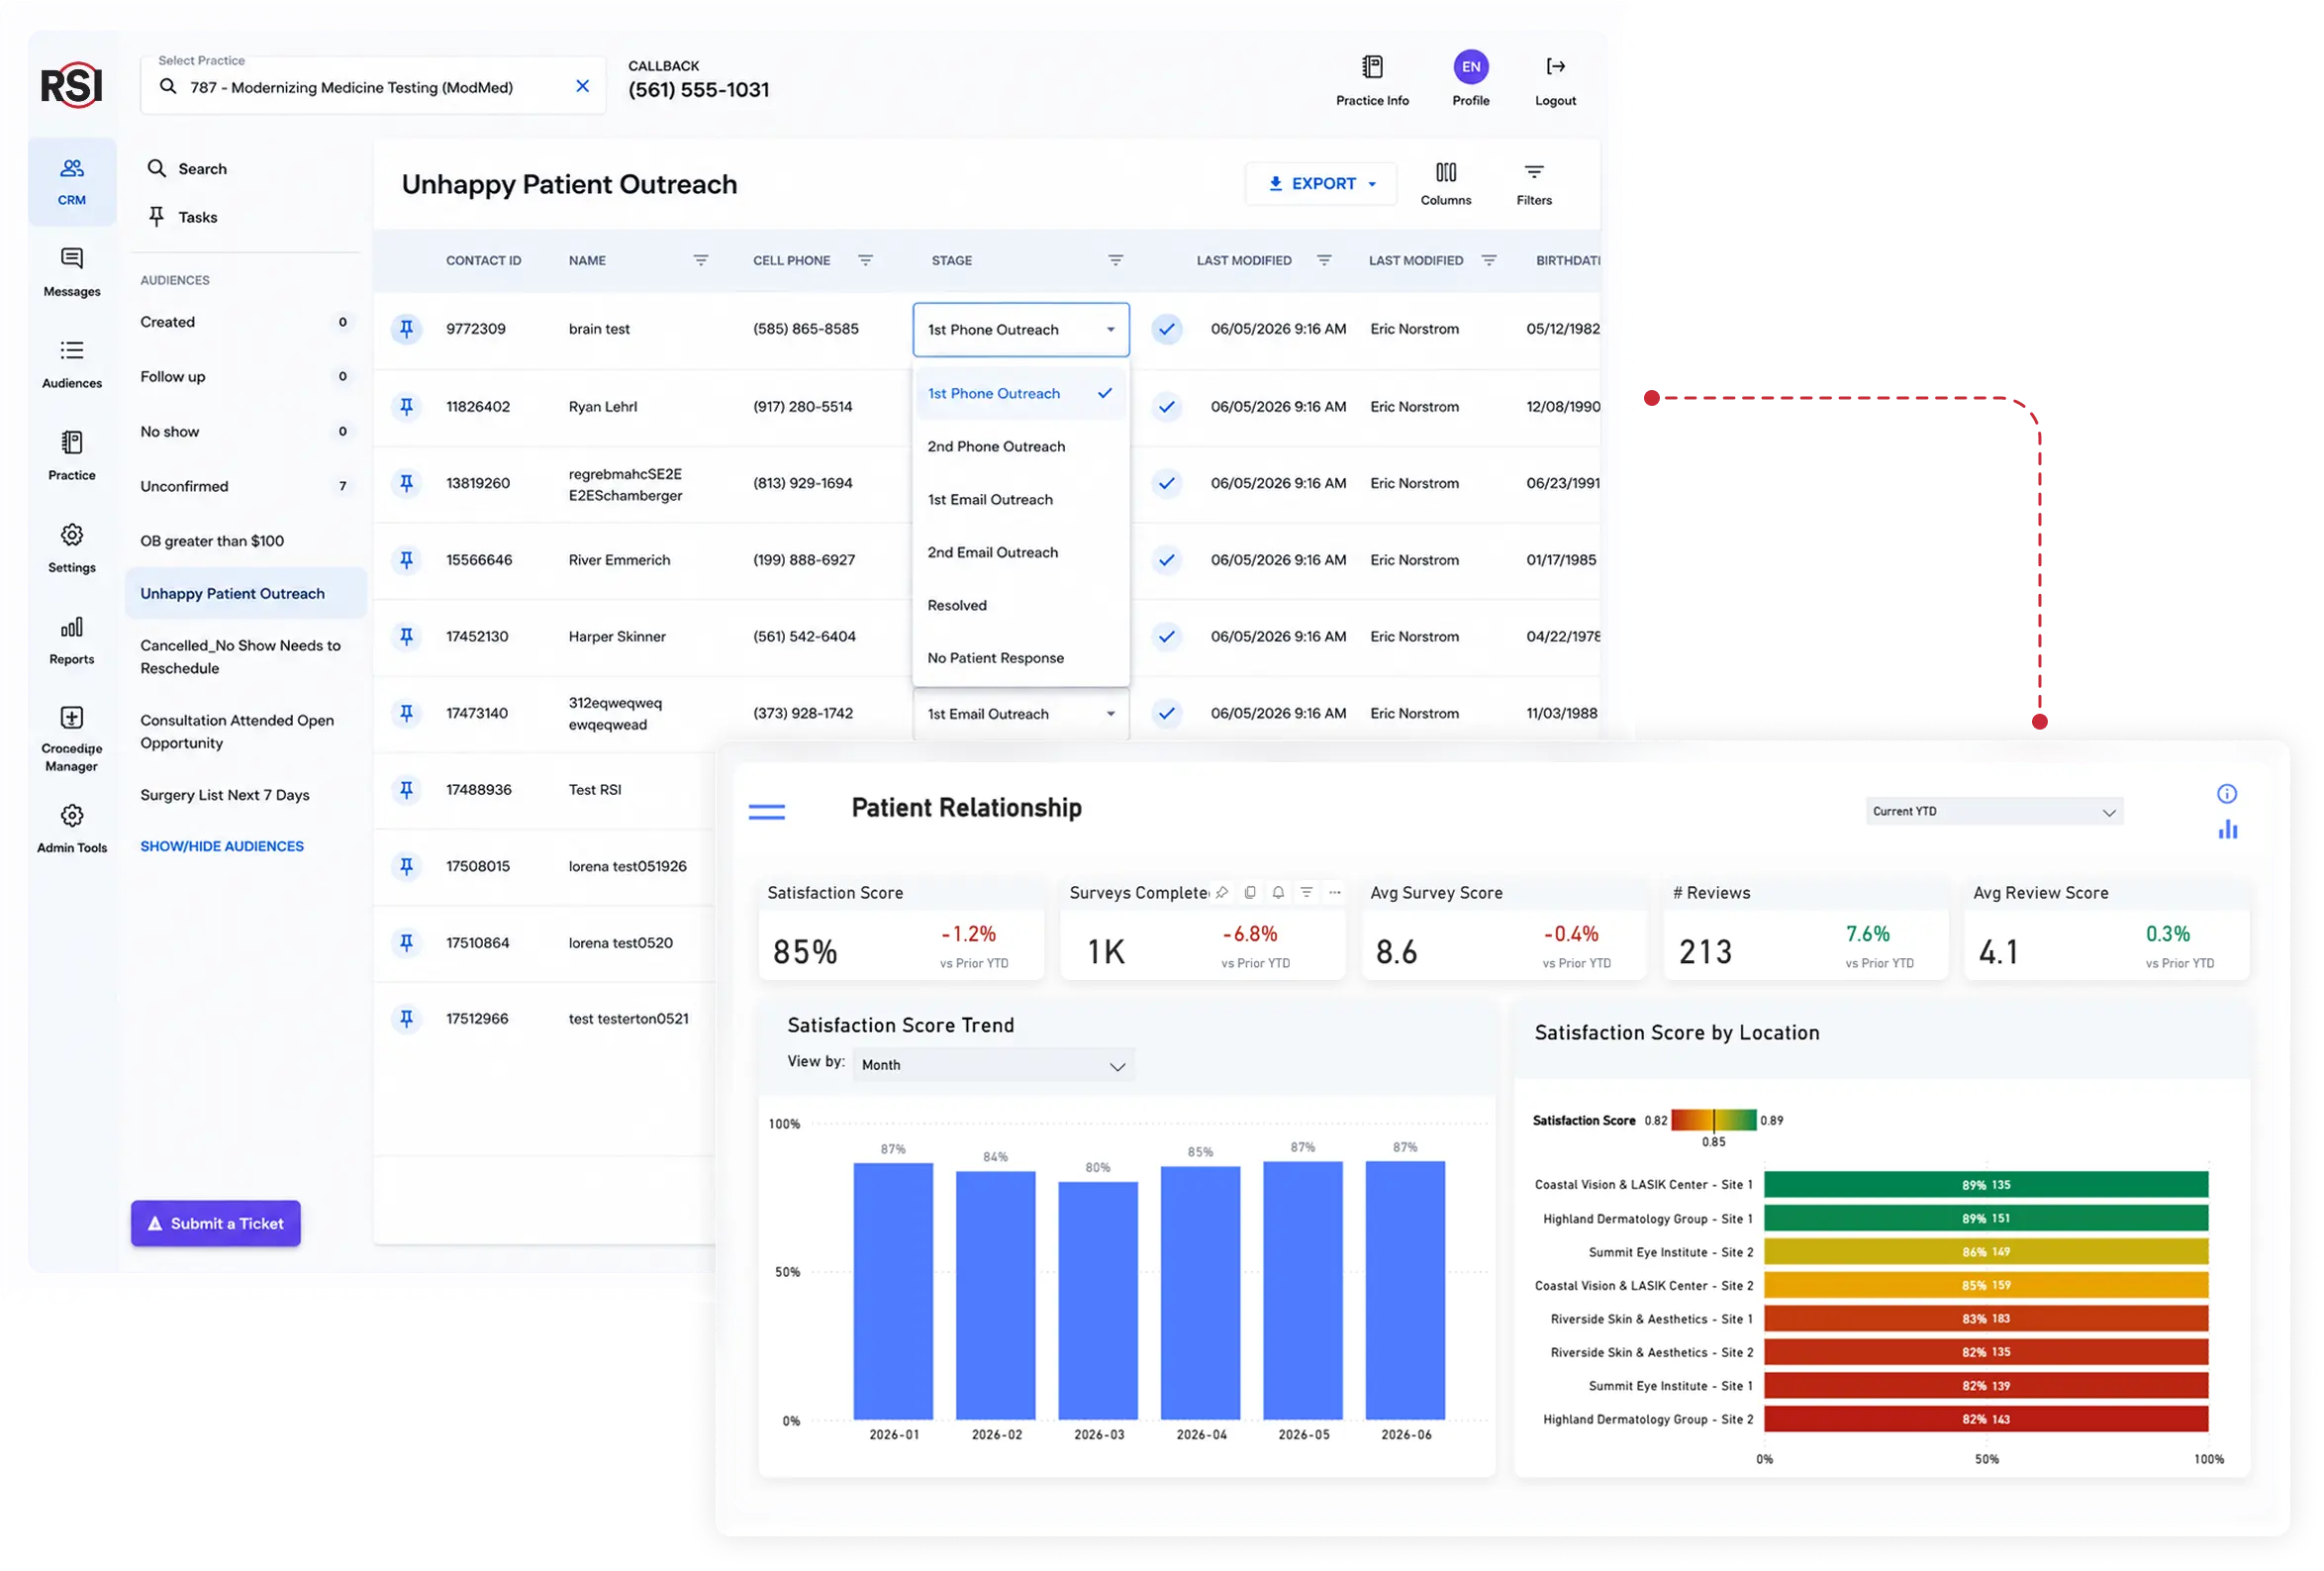
Eliminate patient leakage, visibility gaps, and redundant manual work by bringing your entire practice onto a single, interactive platform.

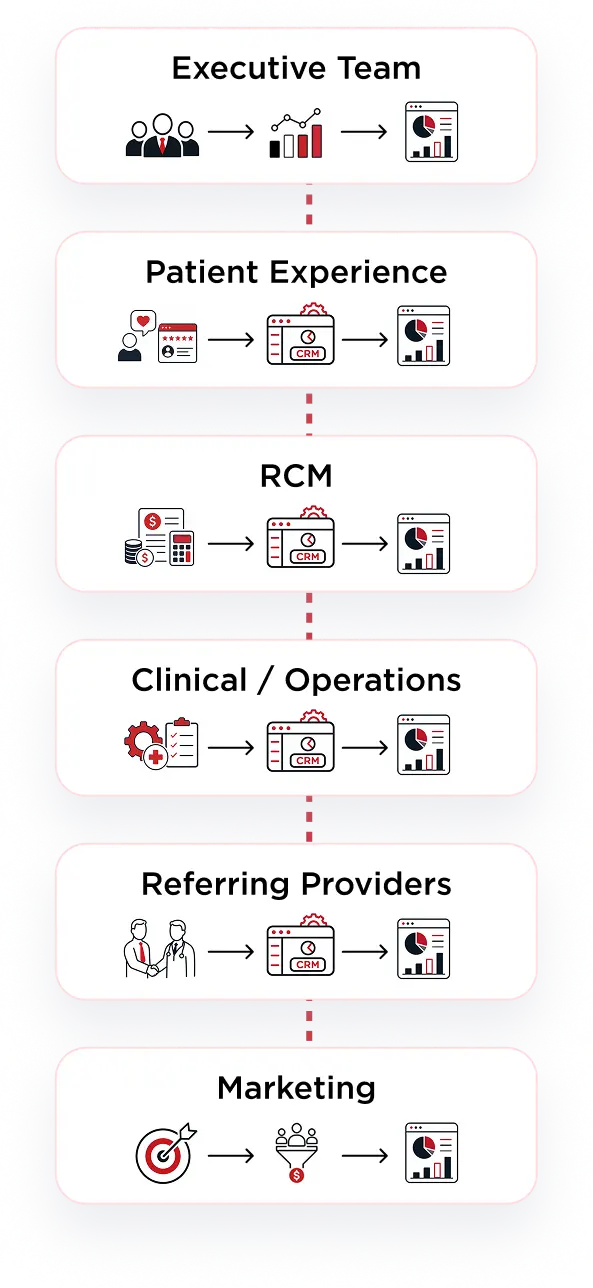
The patient journey is not a series of isolated events; it is a continuous, interconnected process in which every department depends on the others. Marketing relies on the contact center for scheduling inquiries, clinical coordinators rely on accurate scheduling, and RCM depends on clinical clearance. When these teams operate within fragmented, siloed systems, critical context gets lost during patient handoffs. This fragmentation creates dangerous visibility challenges, leading to patient leakage and forcing your staff into redundant manual data entry.

RSI’s Patient Relationship and Revenue Intelligence Platform solves this by unifying your entire practice on a single system. We ensure that data flows seamlessly from patient source to clinical care to final billing, guaranteeing that no patient falls through the cracks and your teams never drop the baton.

Connected Intelligence & AutomationConnected Intelligence & Automation
Who We Serve
03
icon

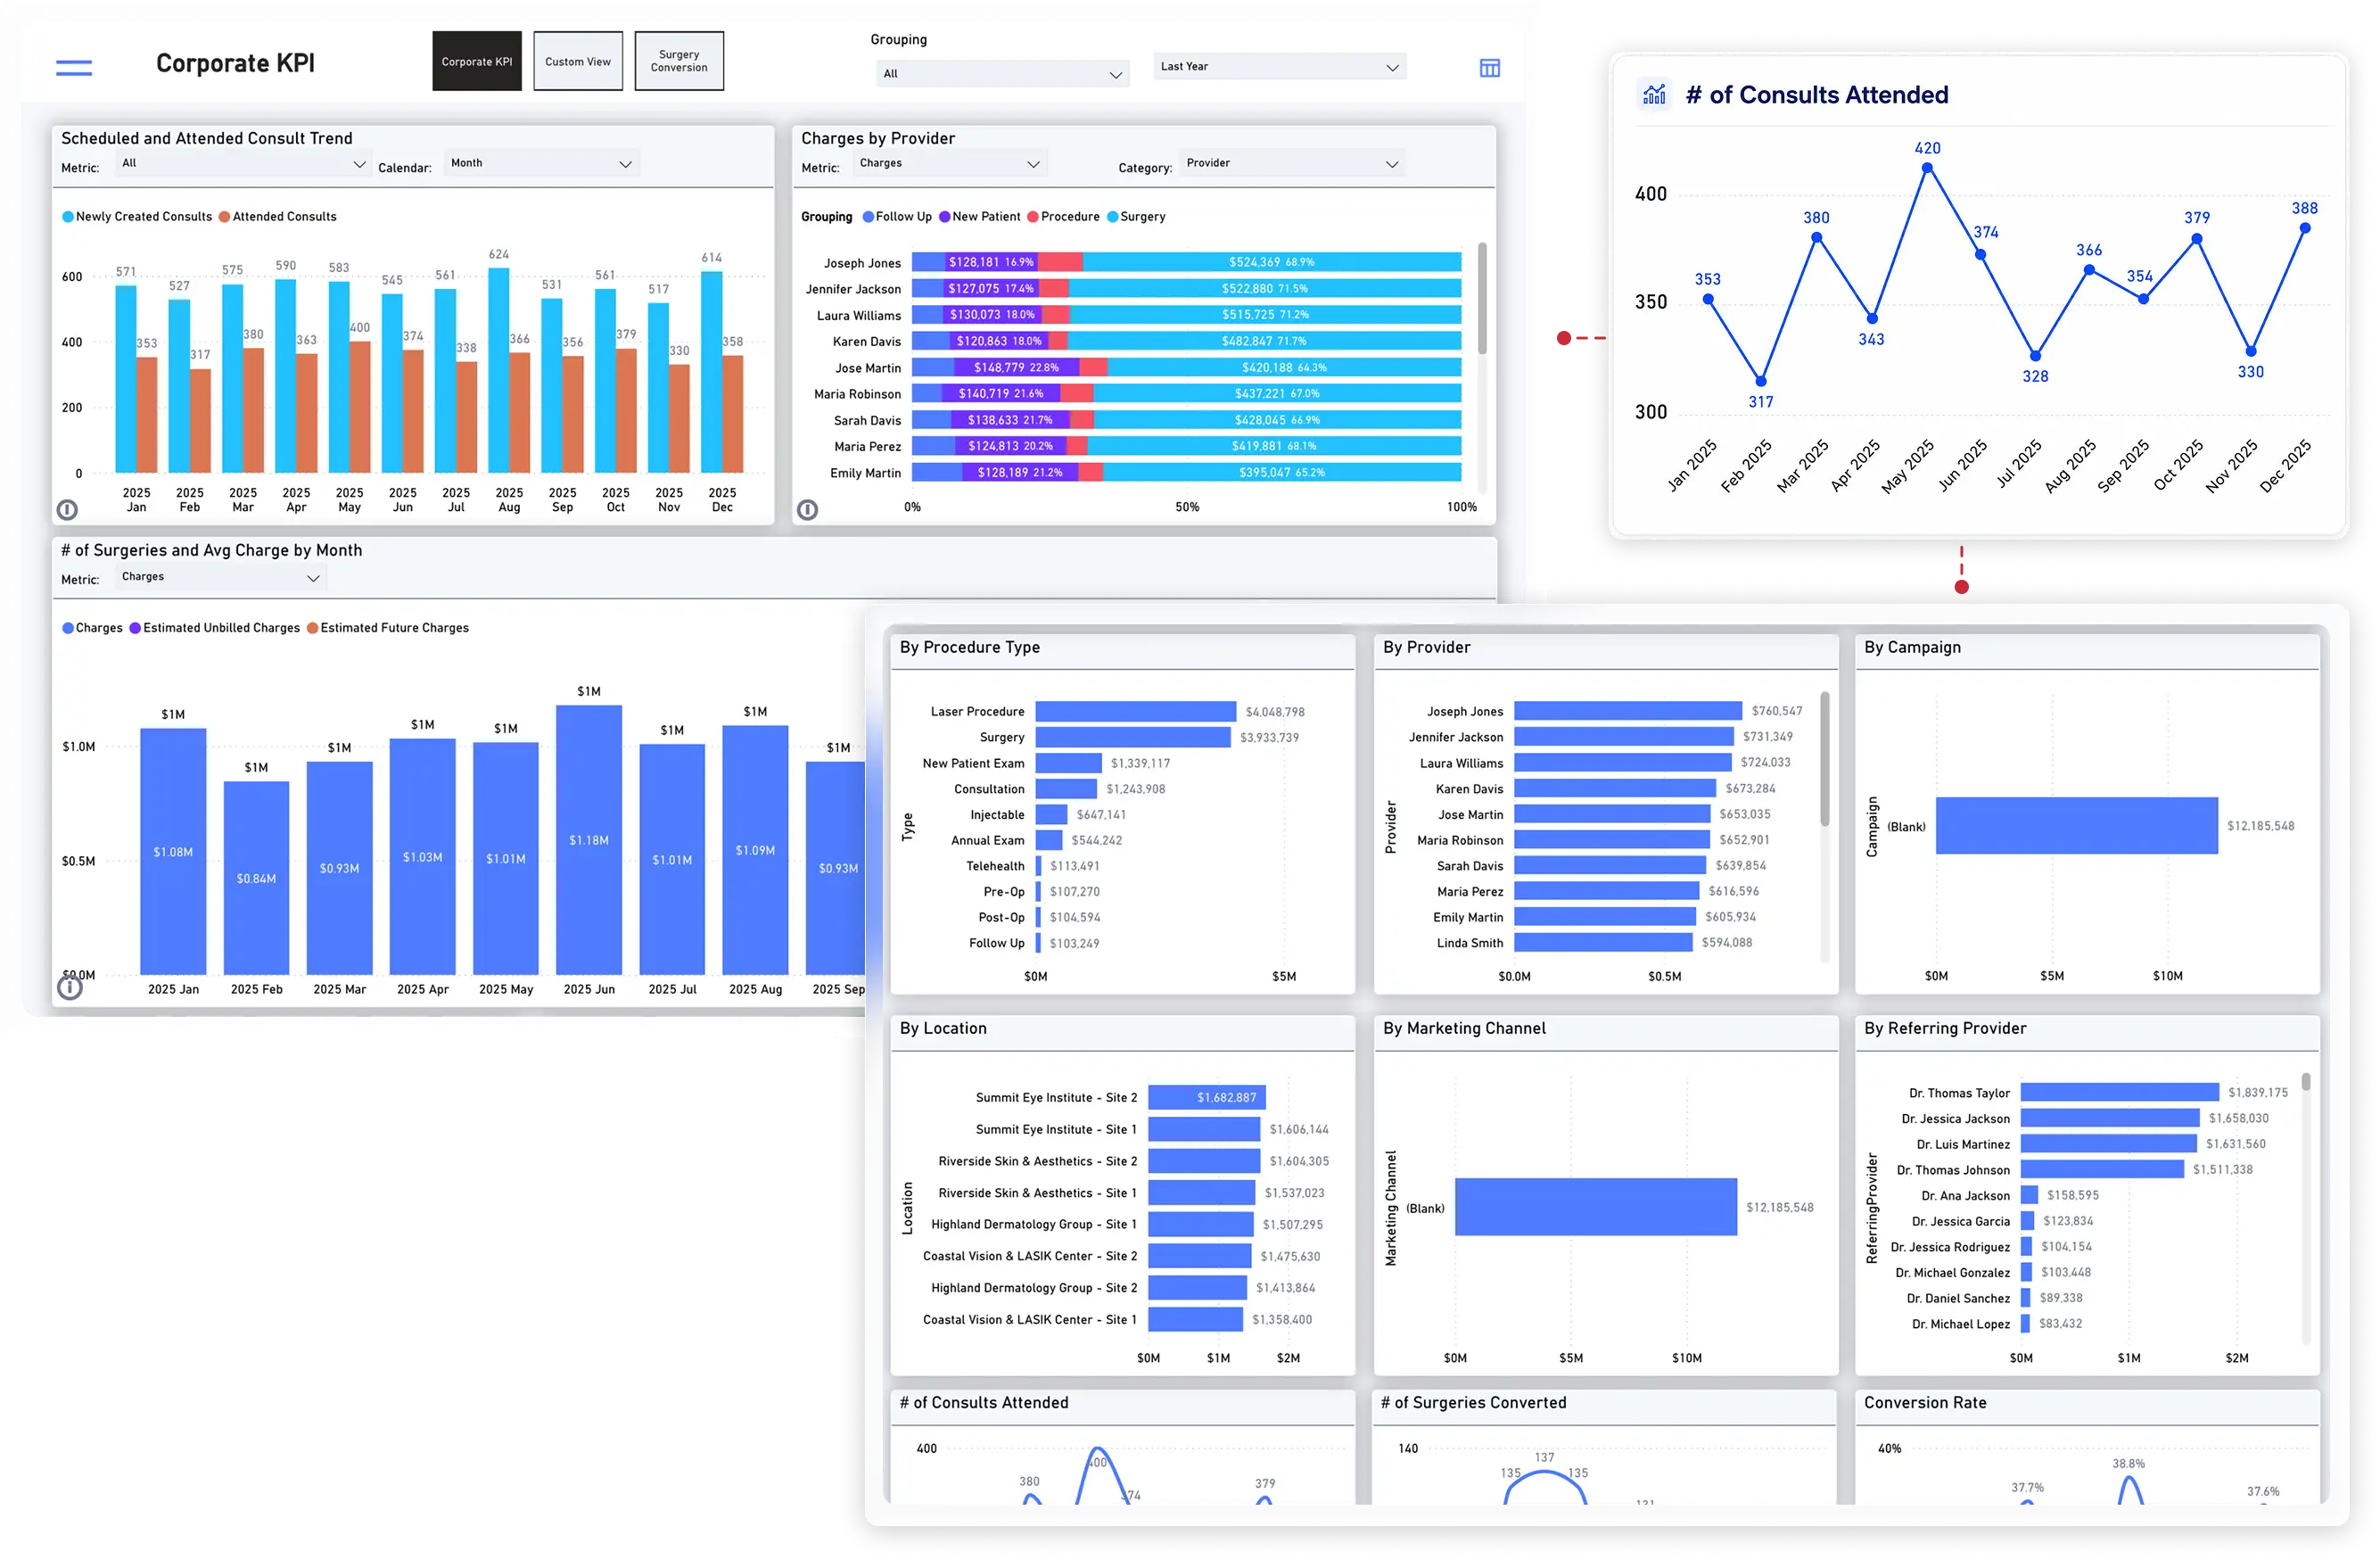
Physician Group Performance Management

You have reports, but not a clear answer.

See what’s driving patient revenue across your entire practice
Collaborate and optimize with every department based on facts and not opinion
View revenue and KPIs
Automate continuous improvement practice wide
Corporate KPI dashboard showing consult trends, charges by provider, surgery volume, and revenue breakdowns by procedure type, location, marketing channel, and referring provider.Red grow gradient
Referring provider dashboard showing patient referral trends and provider performance metrics, alongside RSI CRM inbox and a referral fax cover sheet attachment.Red grow gradient
icon

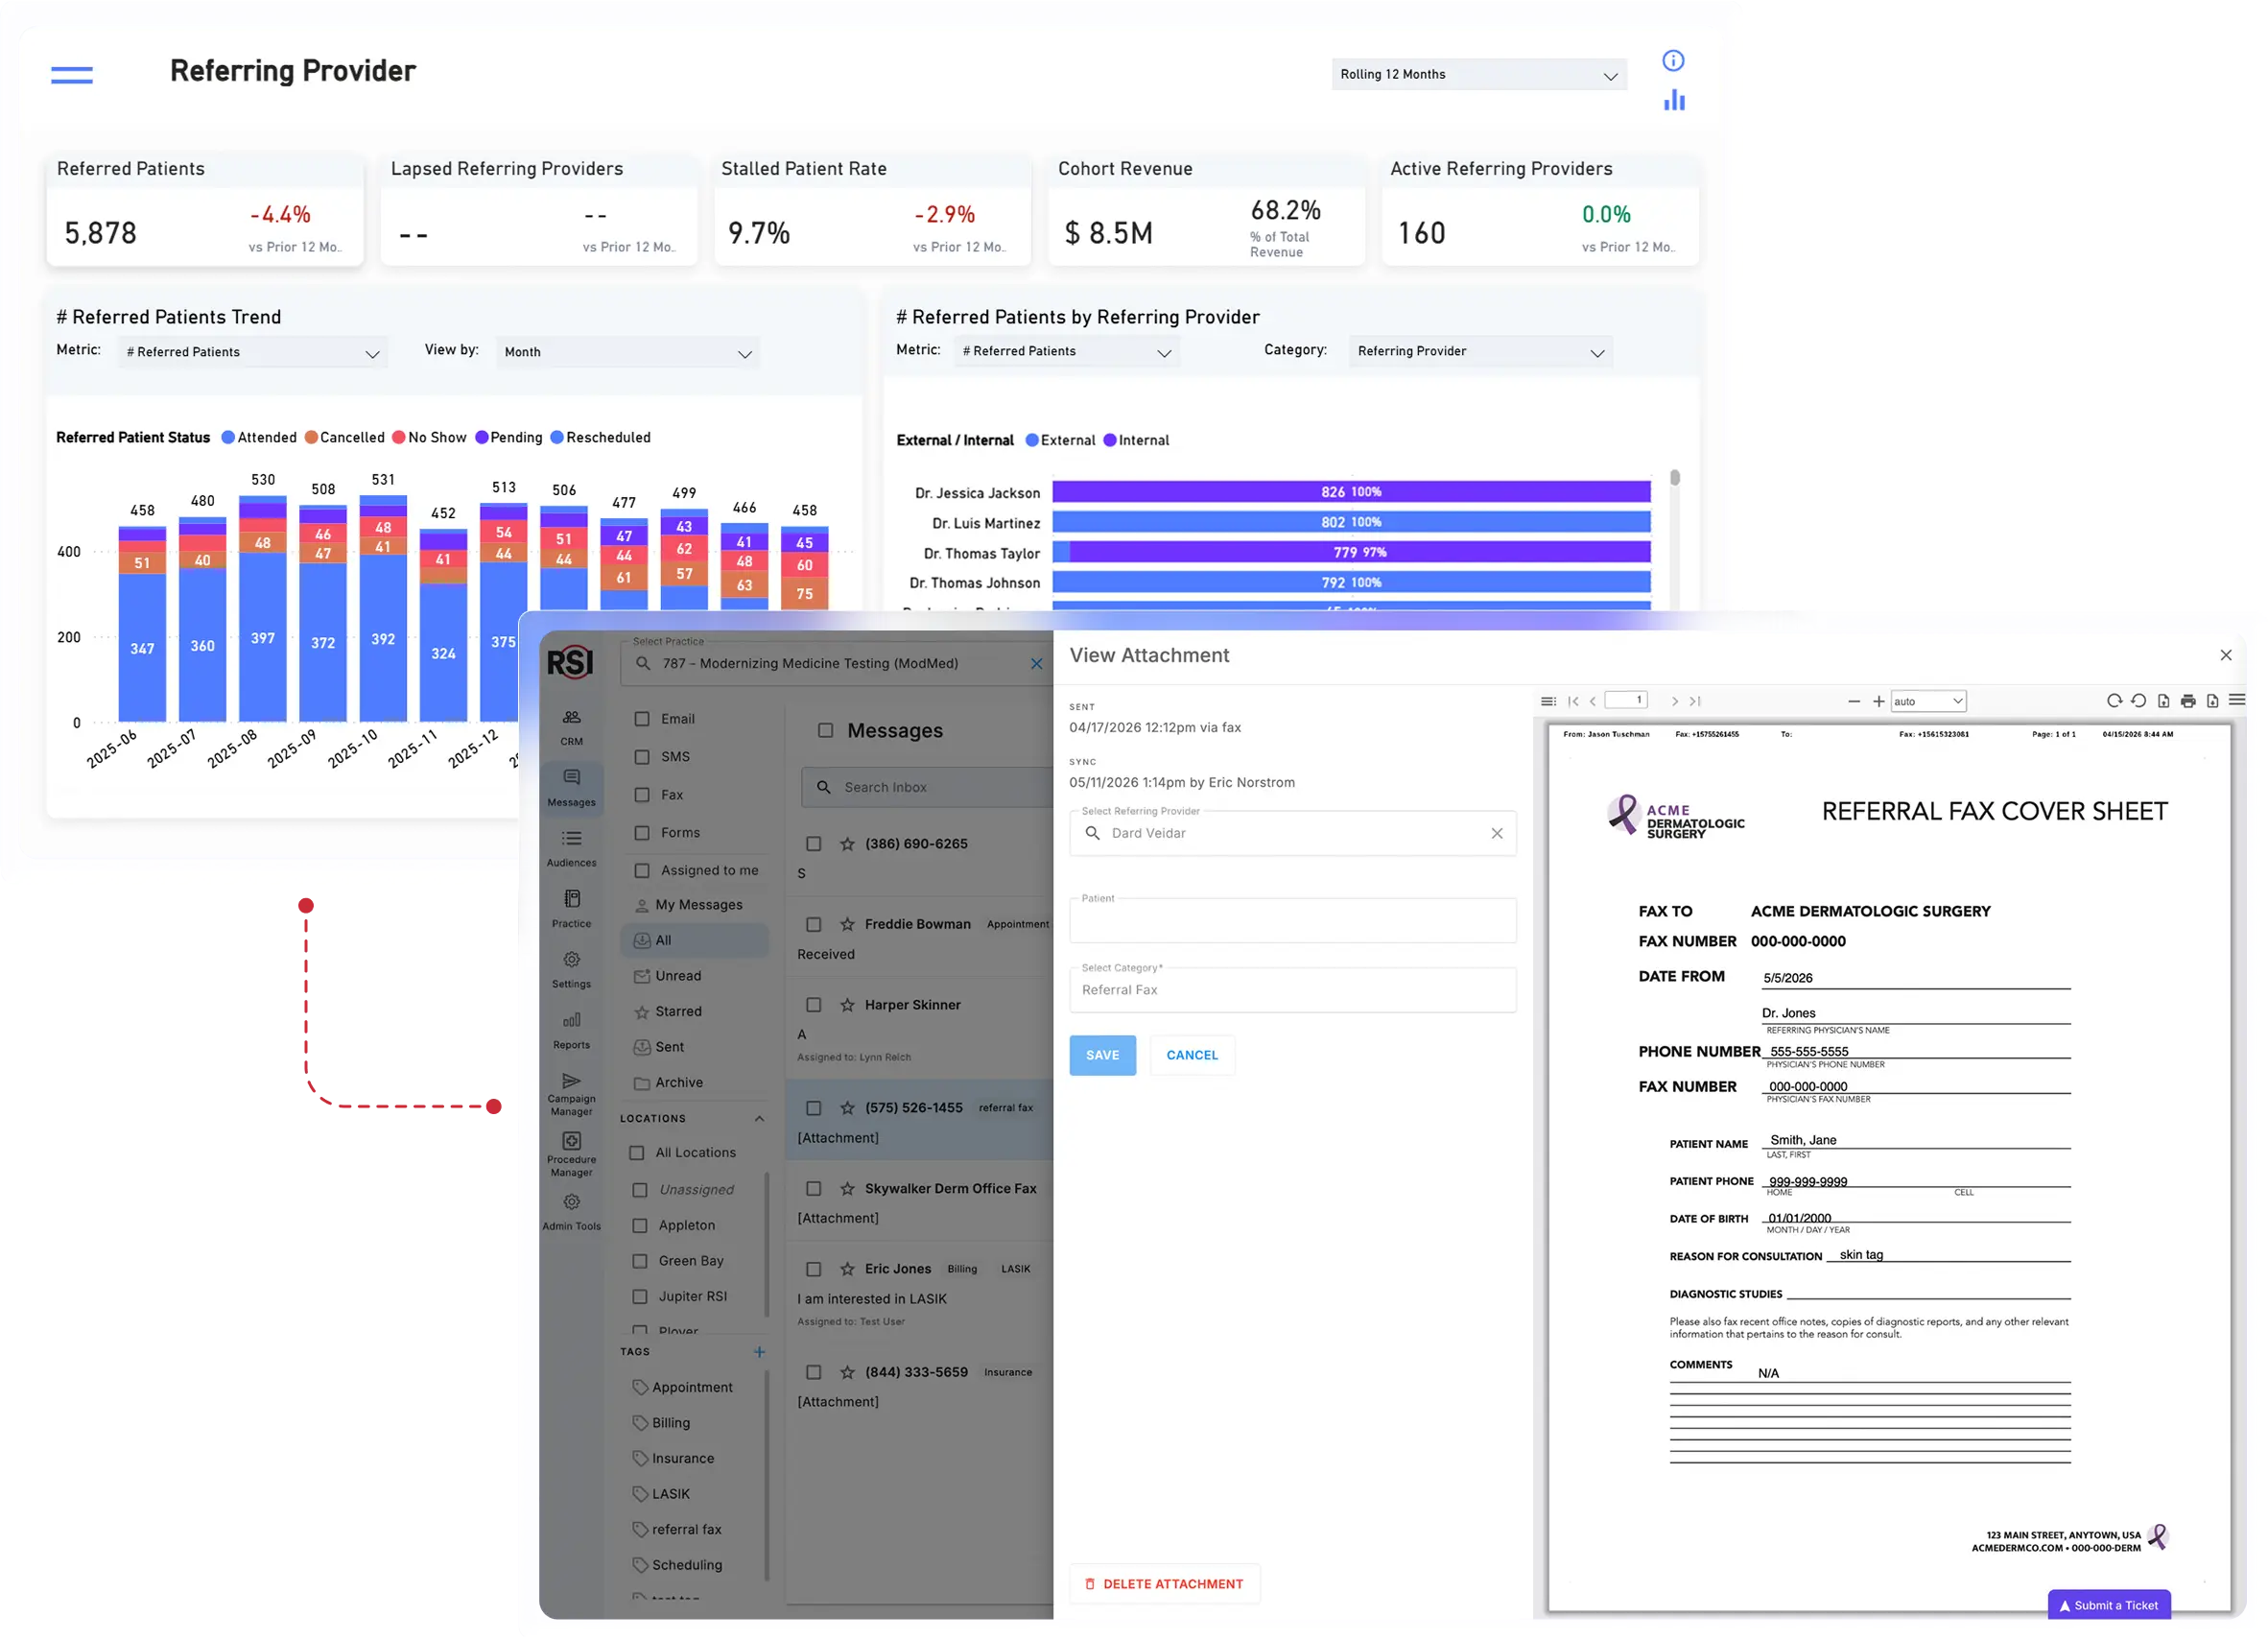
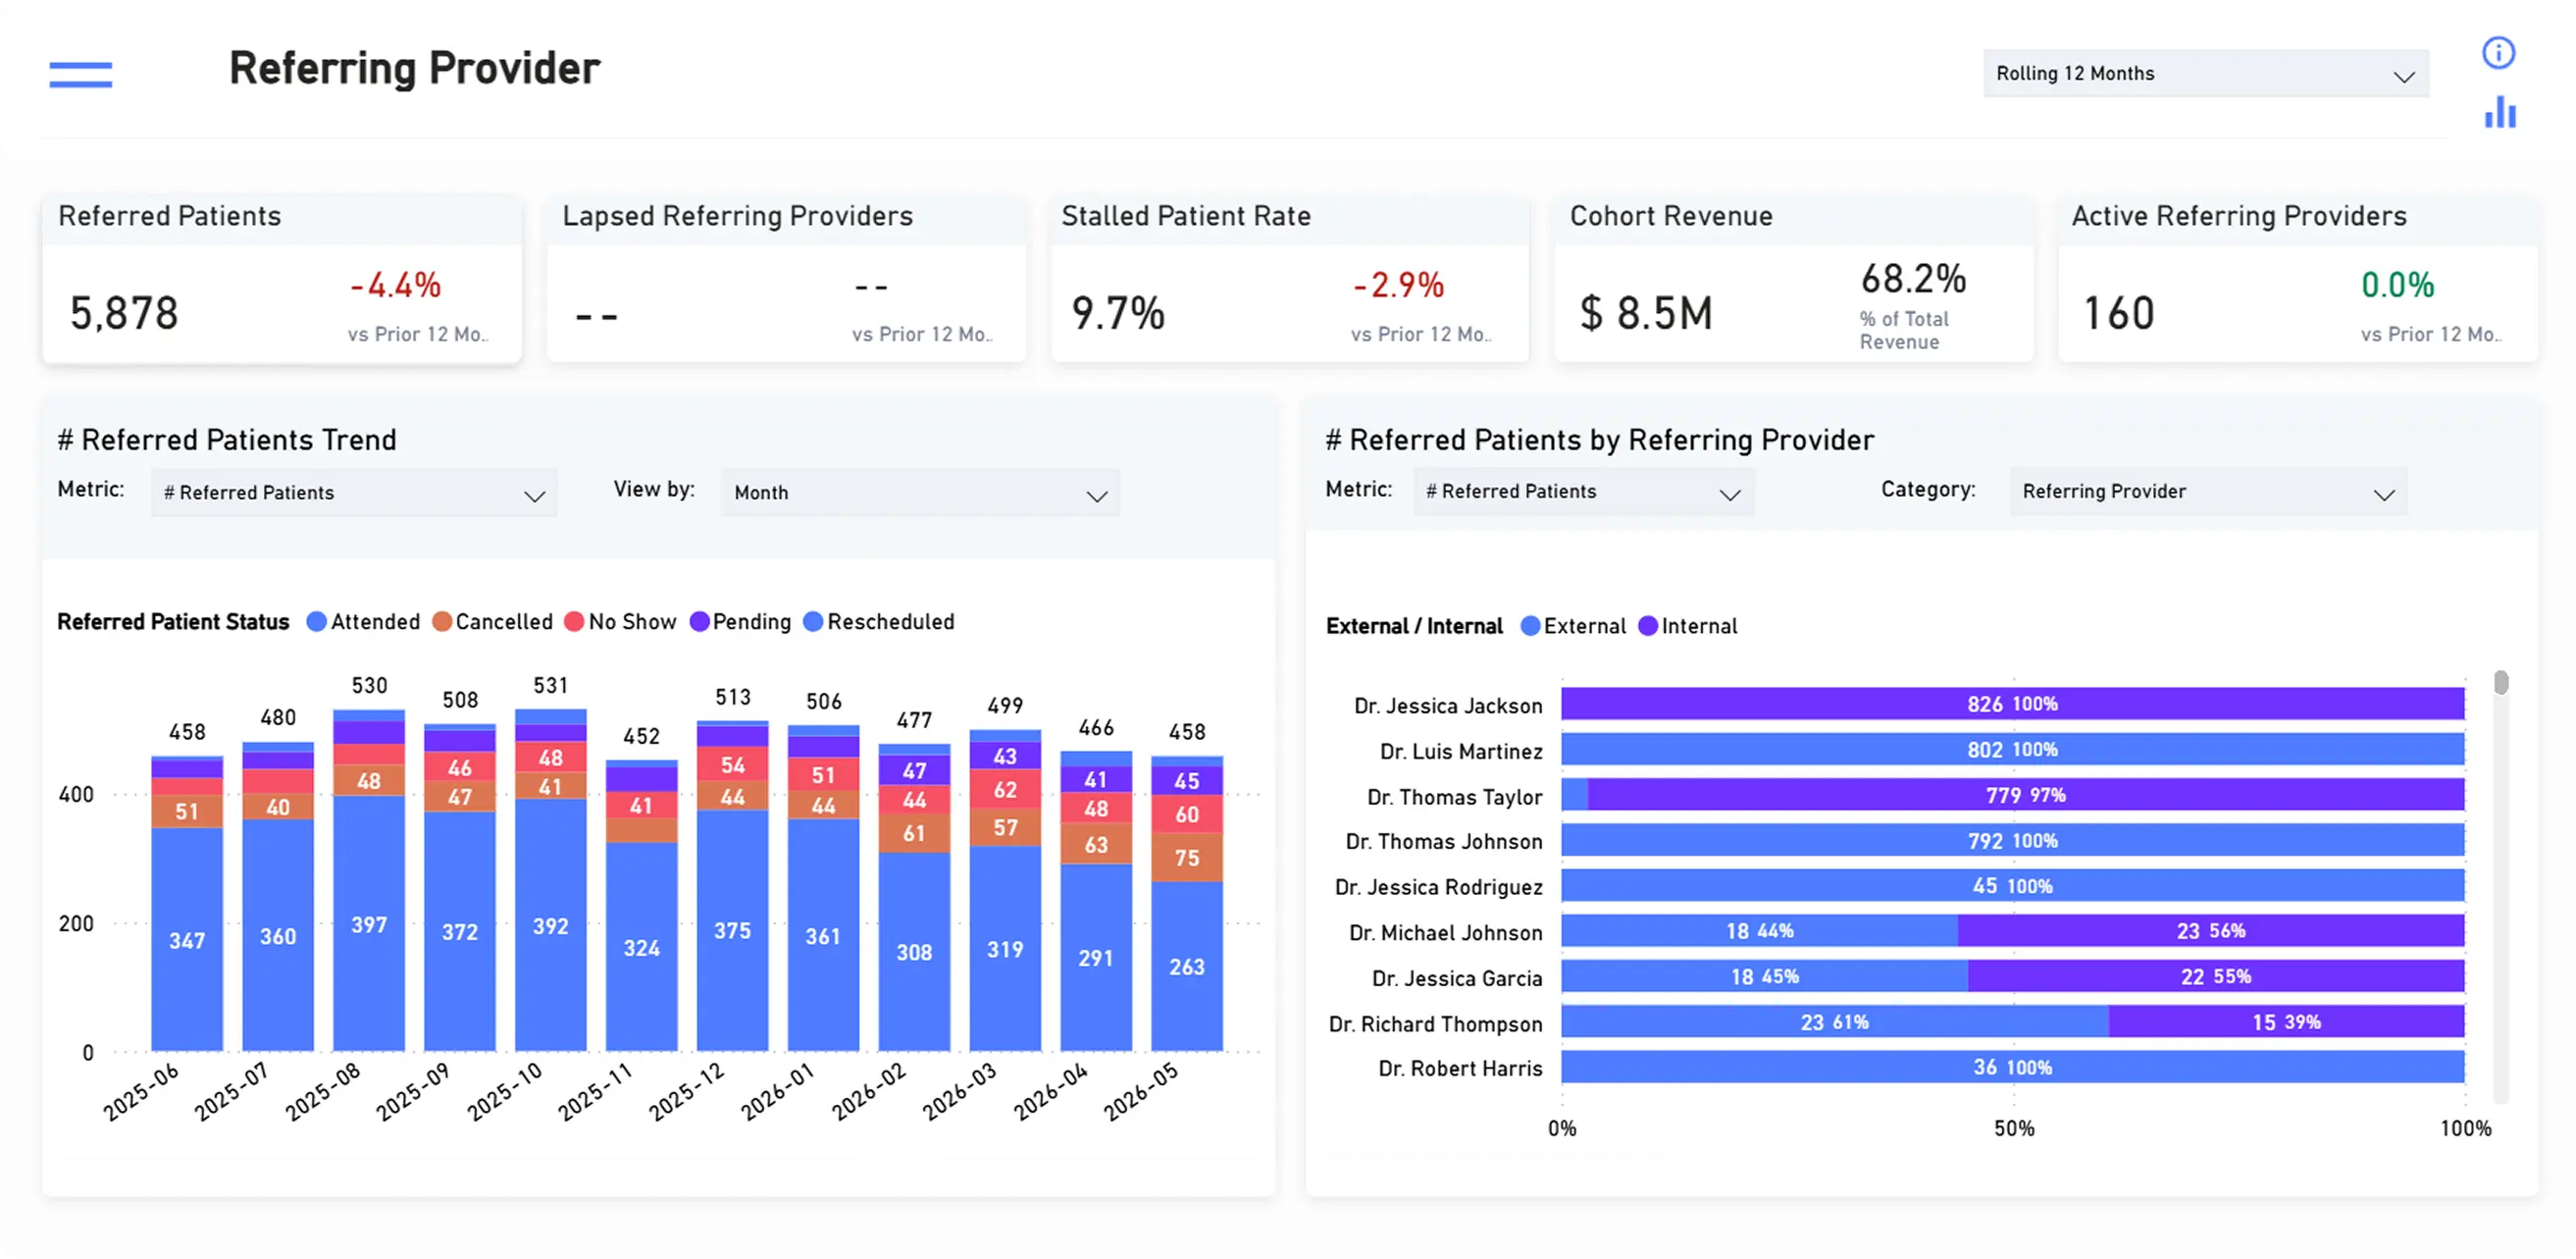
Physician Liaison Management

You know referrals matter, but not which ones actually drive revenue.

See which relationships perform and where opportunities are missed
Improve relationships with automated communication, workflows, and patient updates
Connect liaison planning and communication tools with their referring provider revenue
icon

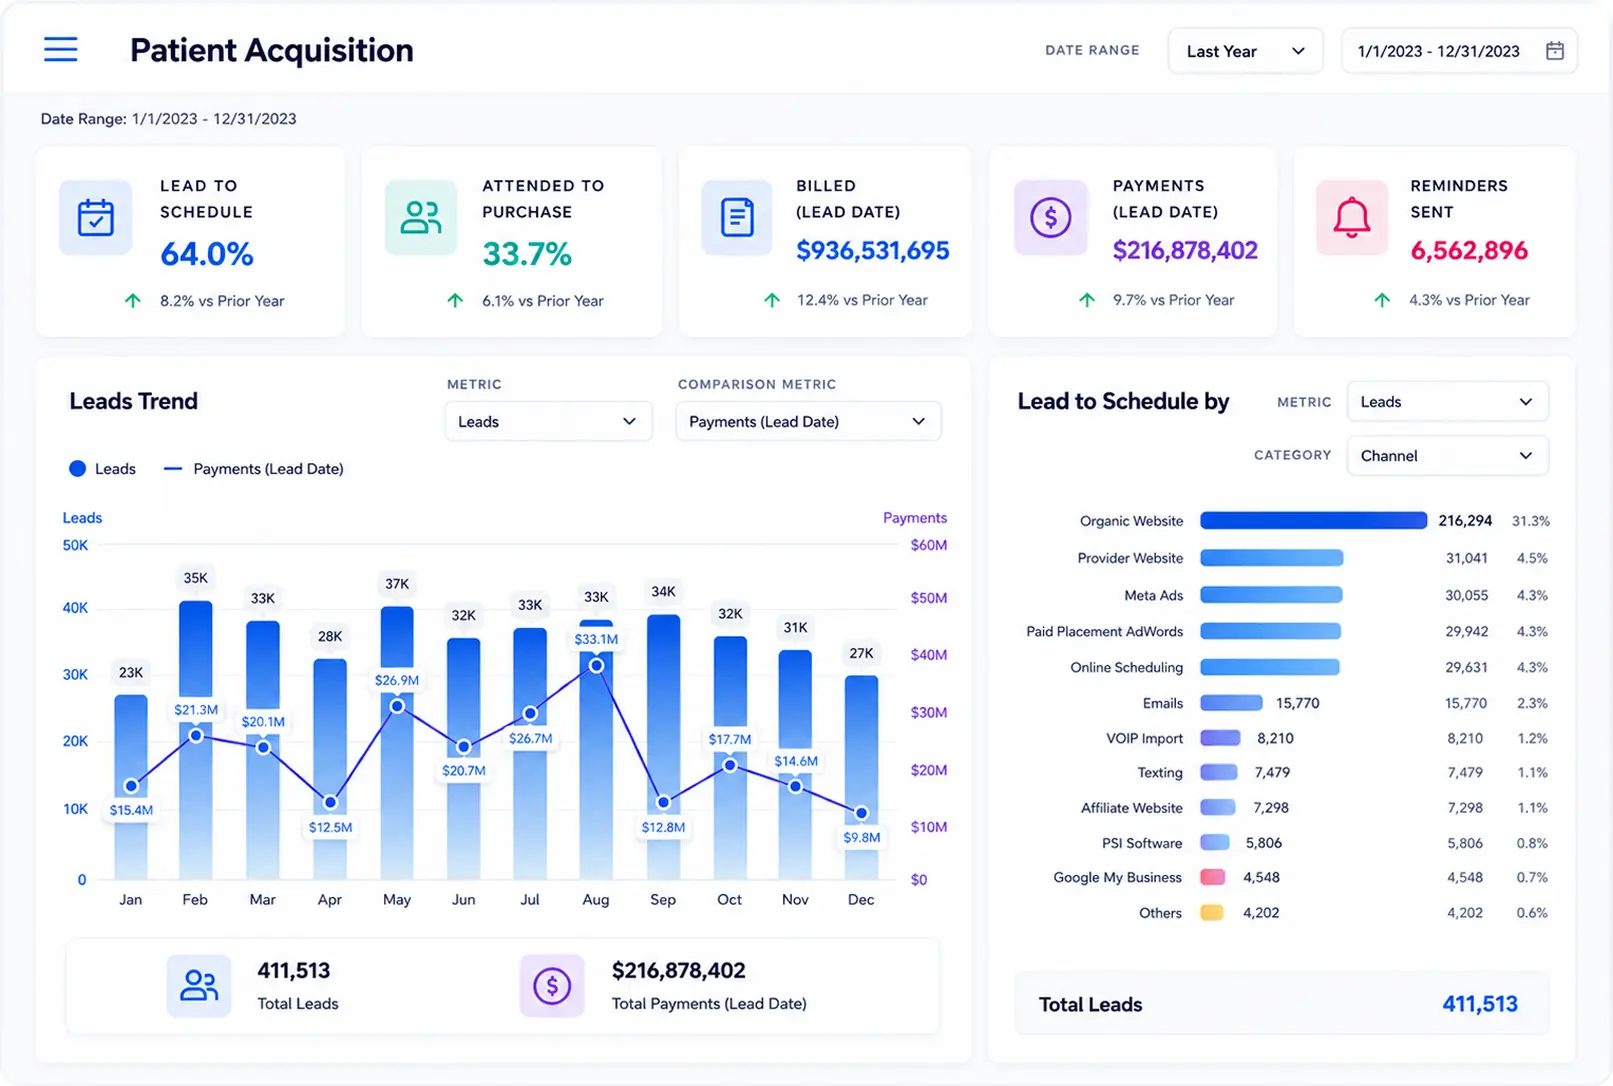
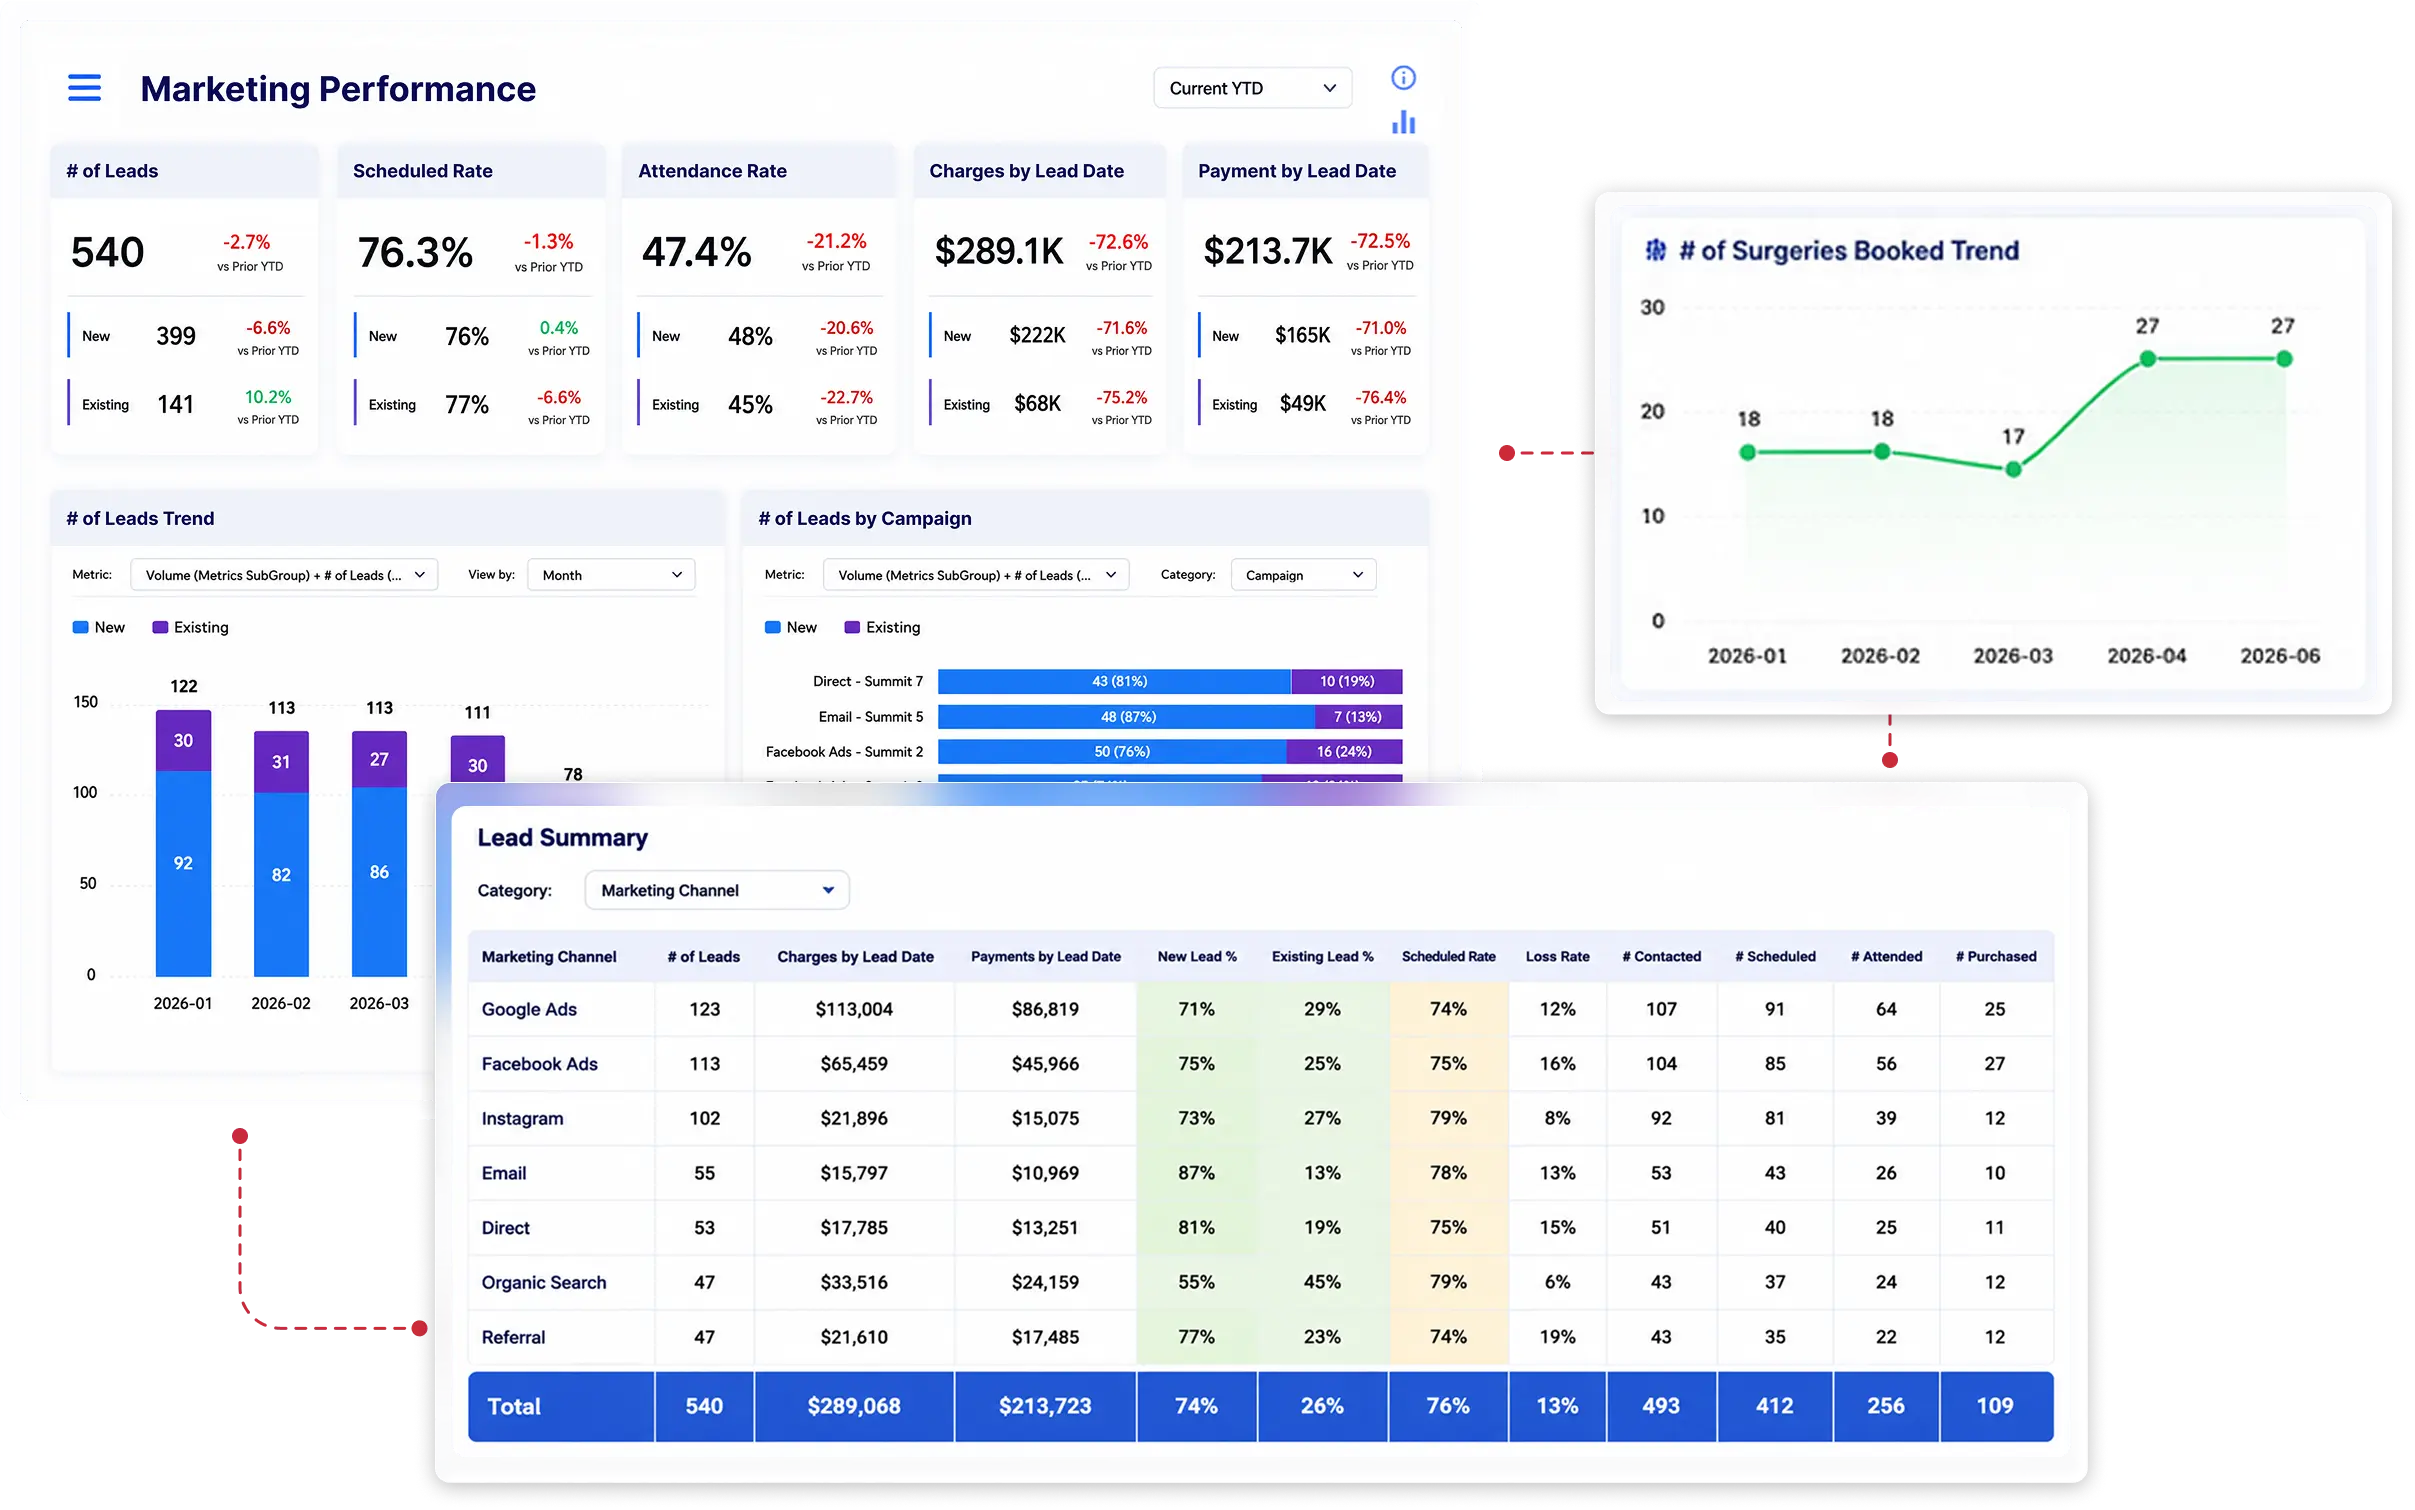
Healthcare Marketing

You’re generating demand, but can’t prove what’s working and why.

See which channels turn into revenue
Identify where departments have leakage
Stop wasting spend
Optimize patient workflows for ROI
Marketing performance dashboard showing leads, scheduled rate, attendance, and charges by campaign with surgery booking trend chart and lead summary by channel.Red grow gradient
RSI appointment finder showing available time slots by provider alongside a patient text conversation with insurance card submission.Red grow gradient
icon

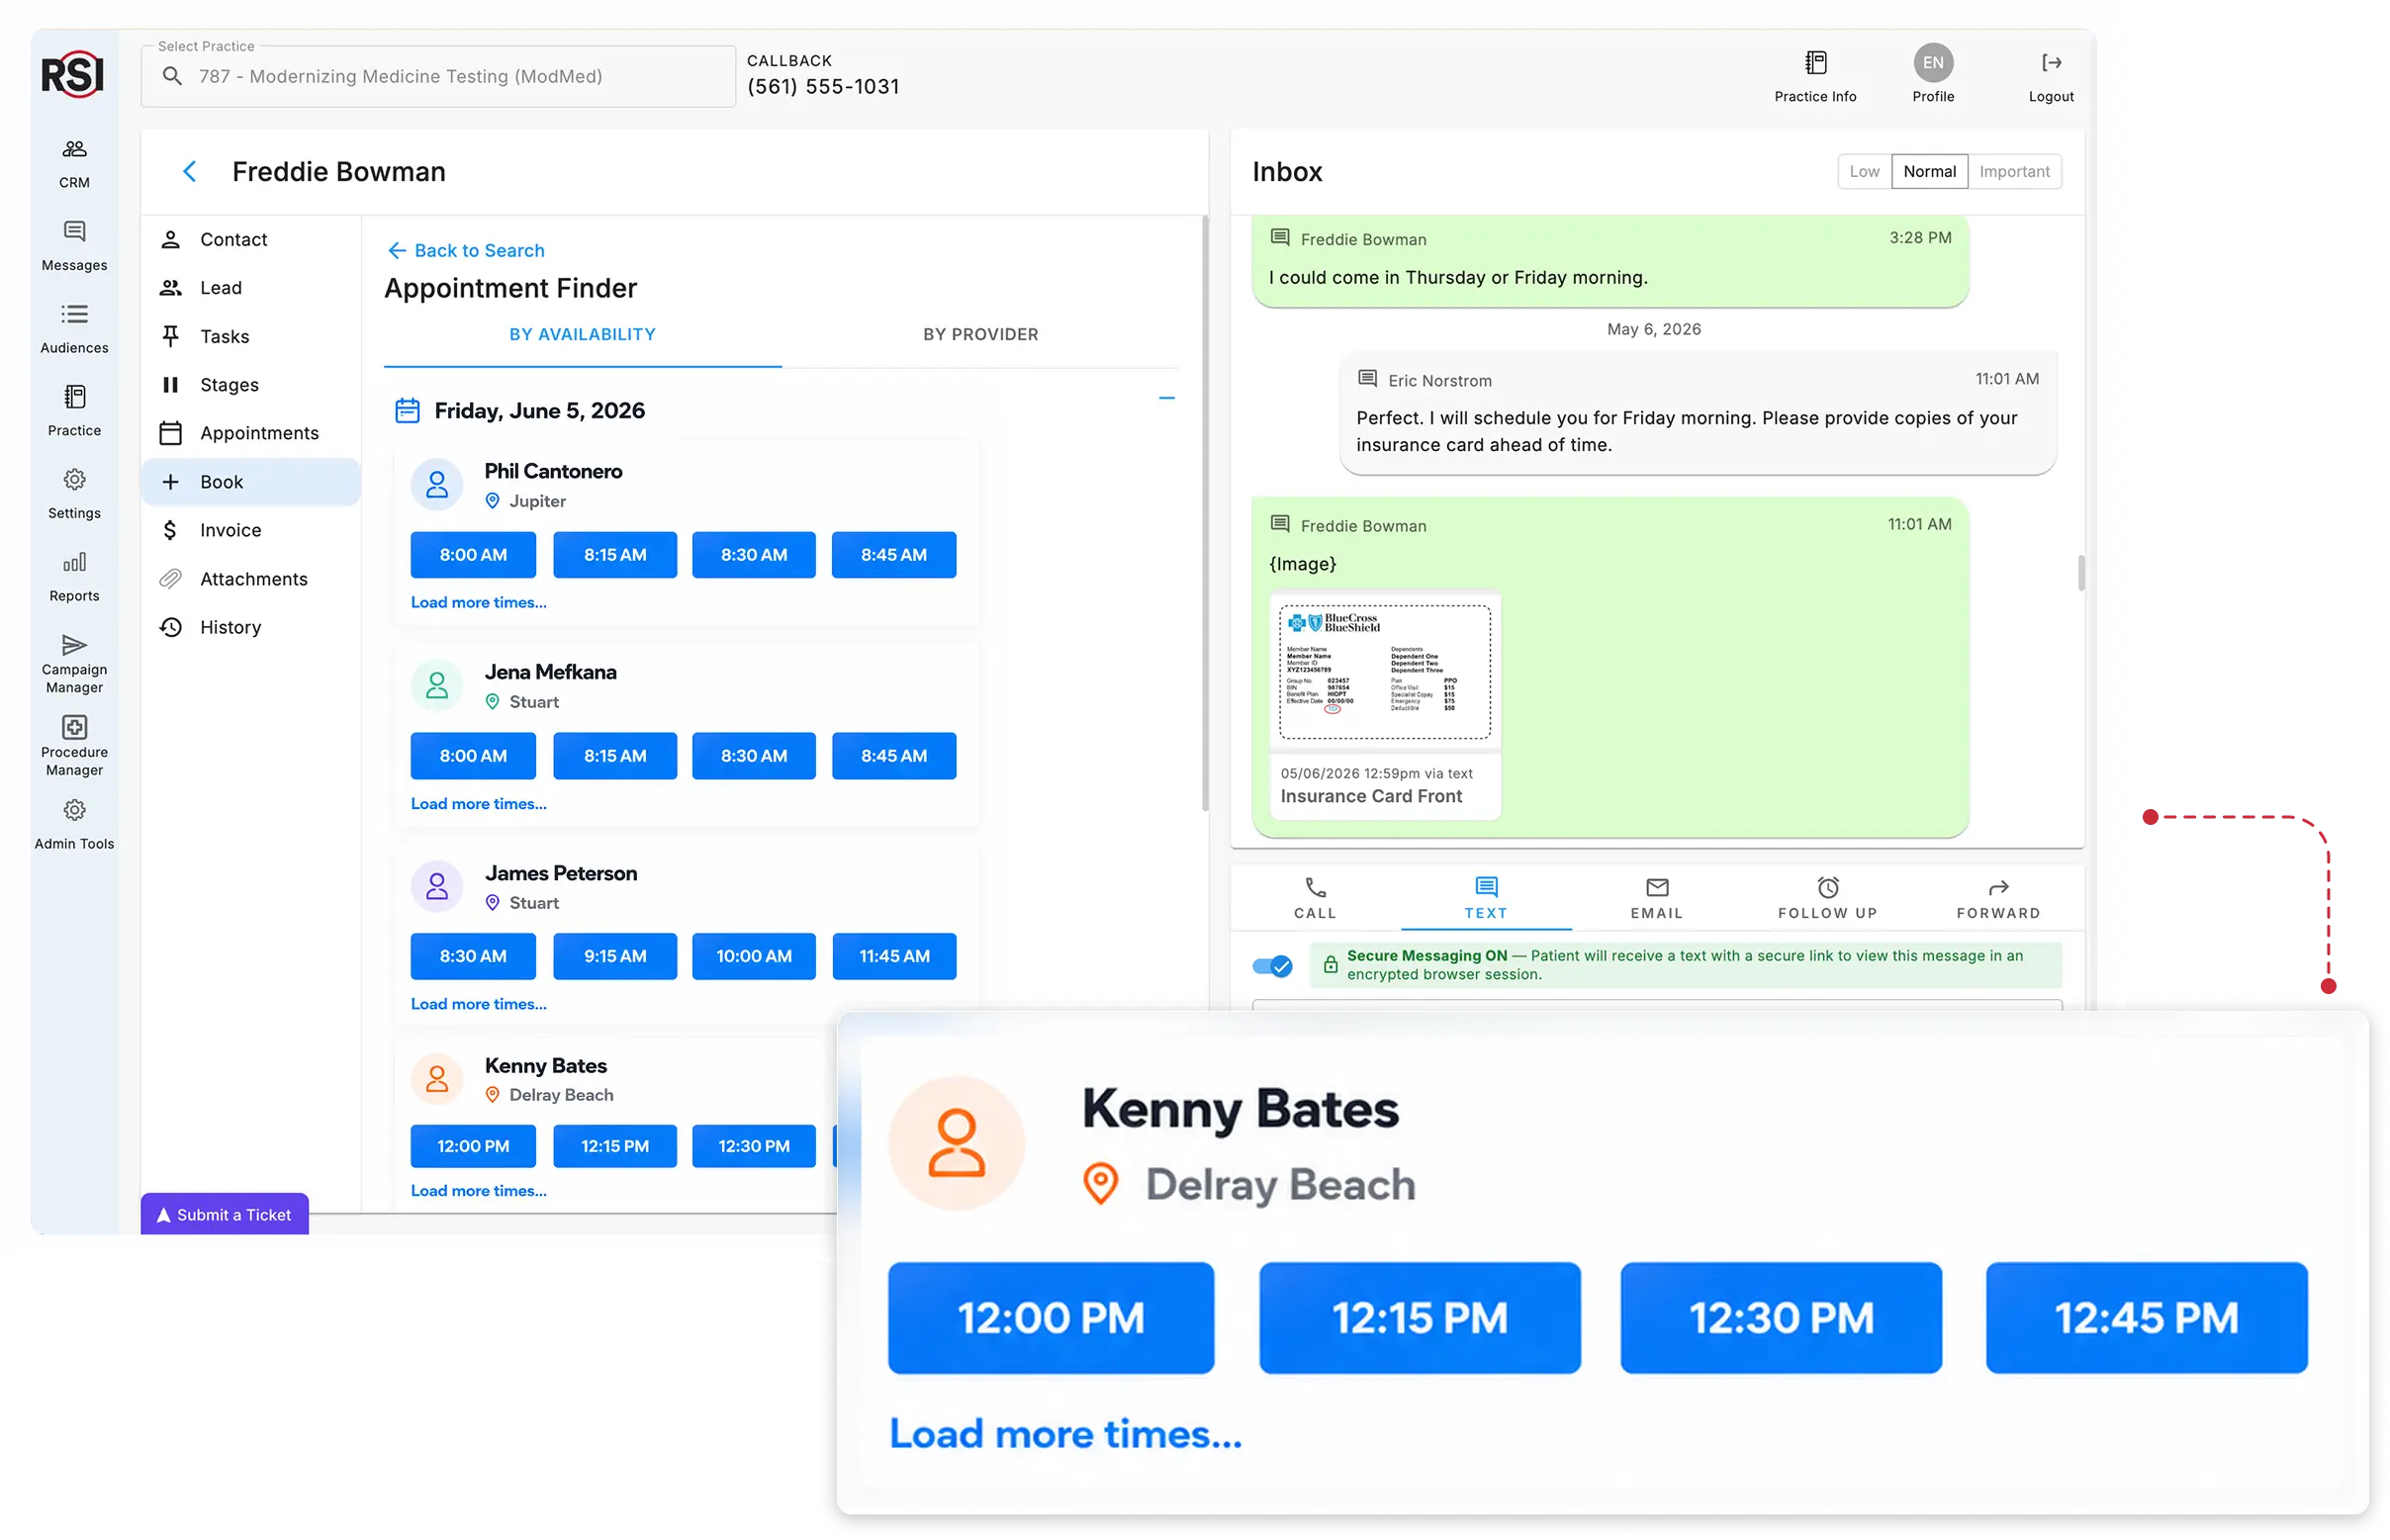
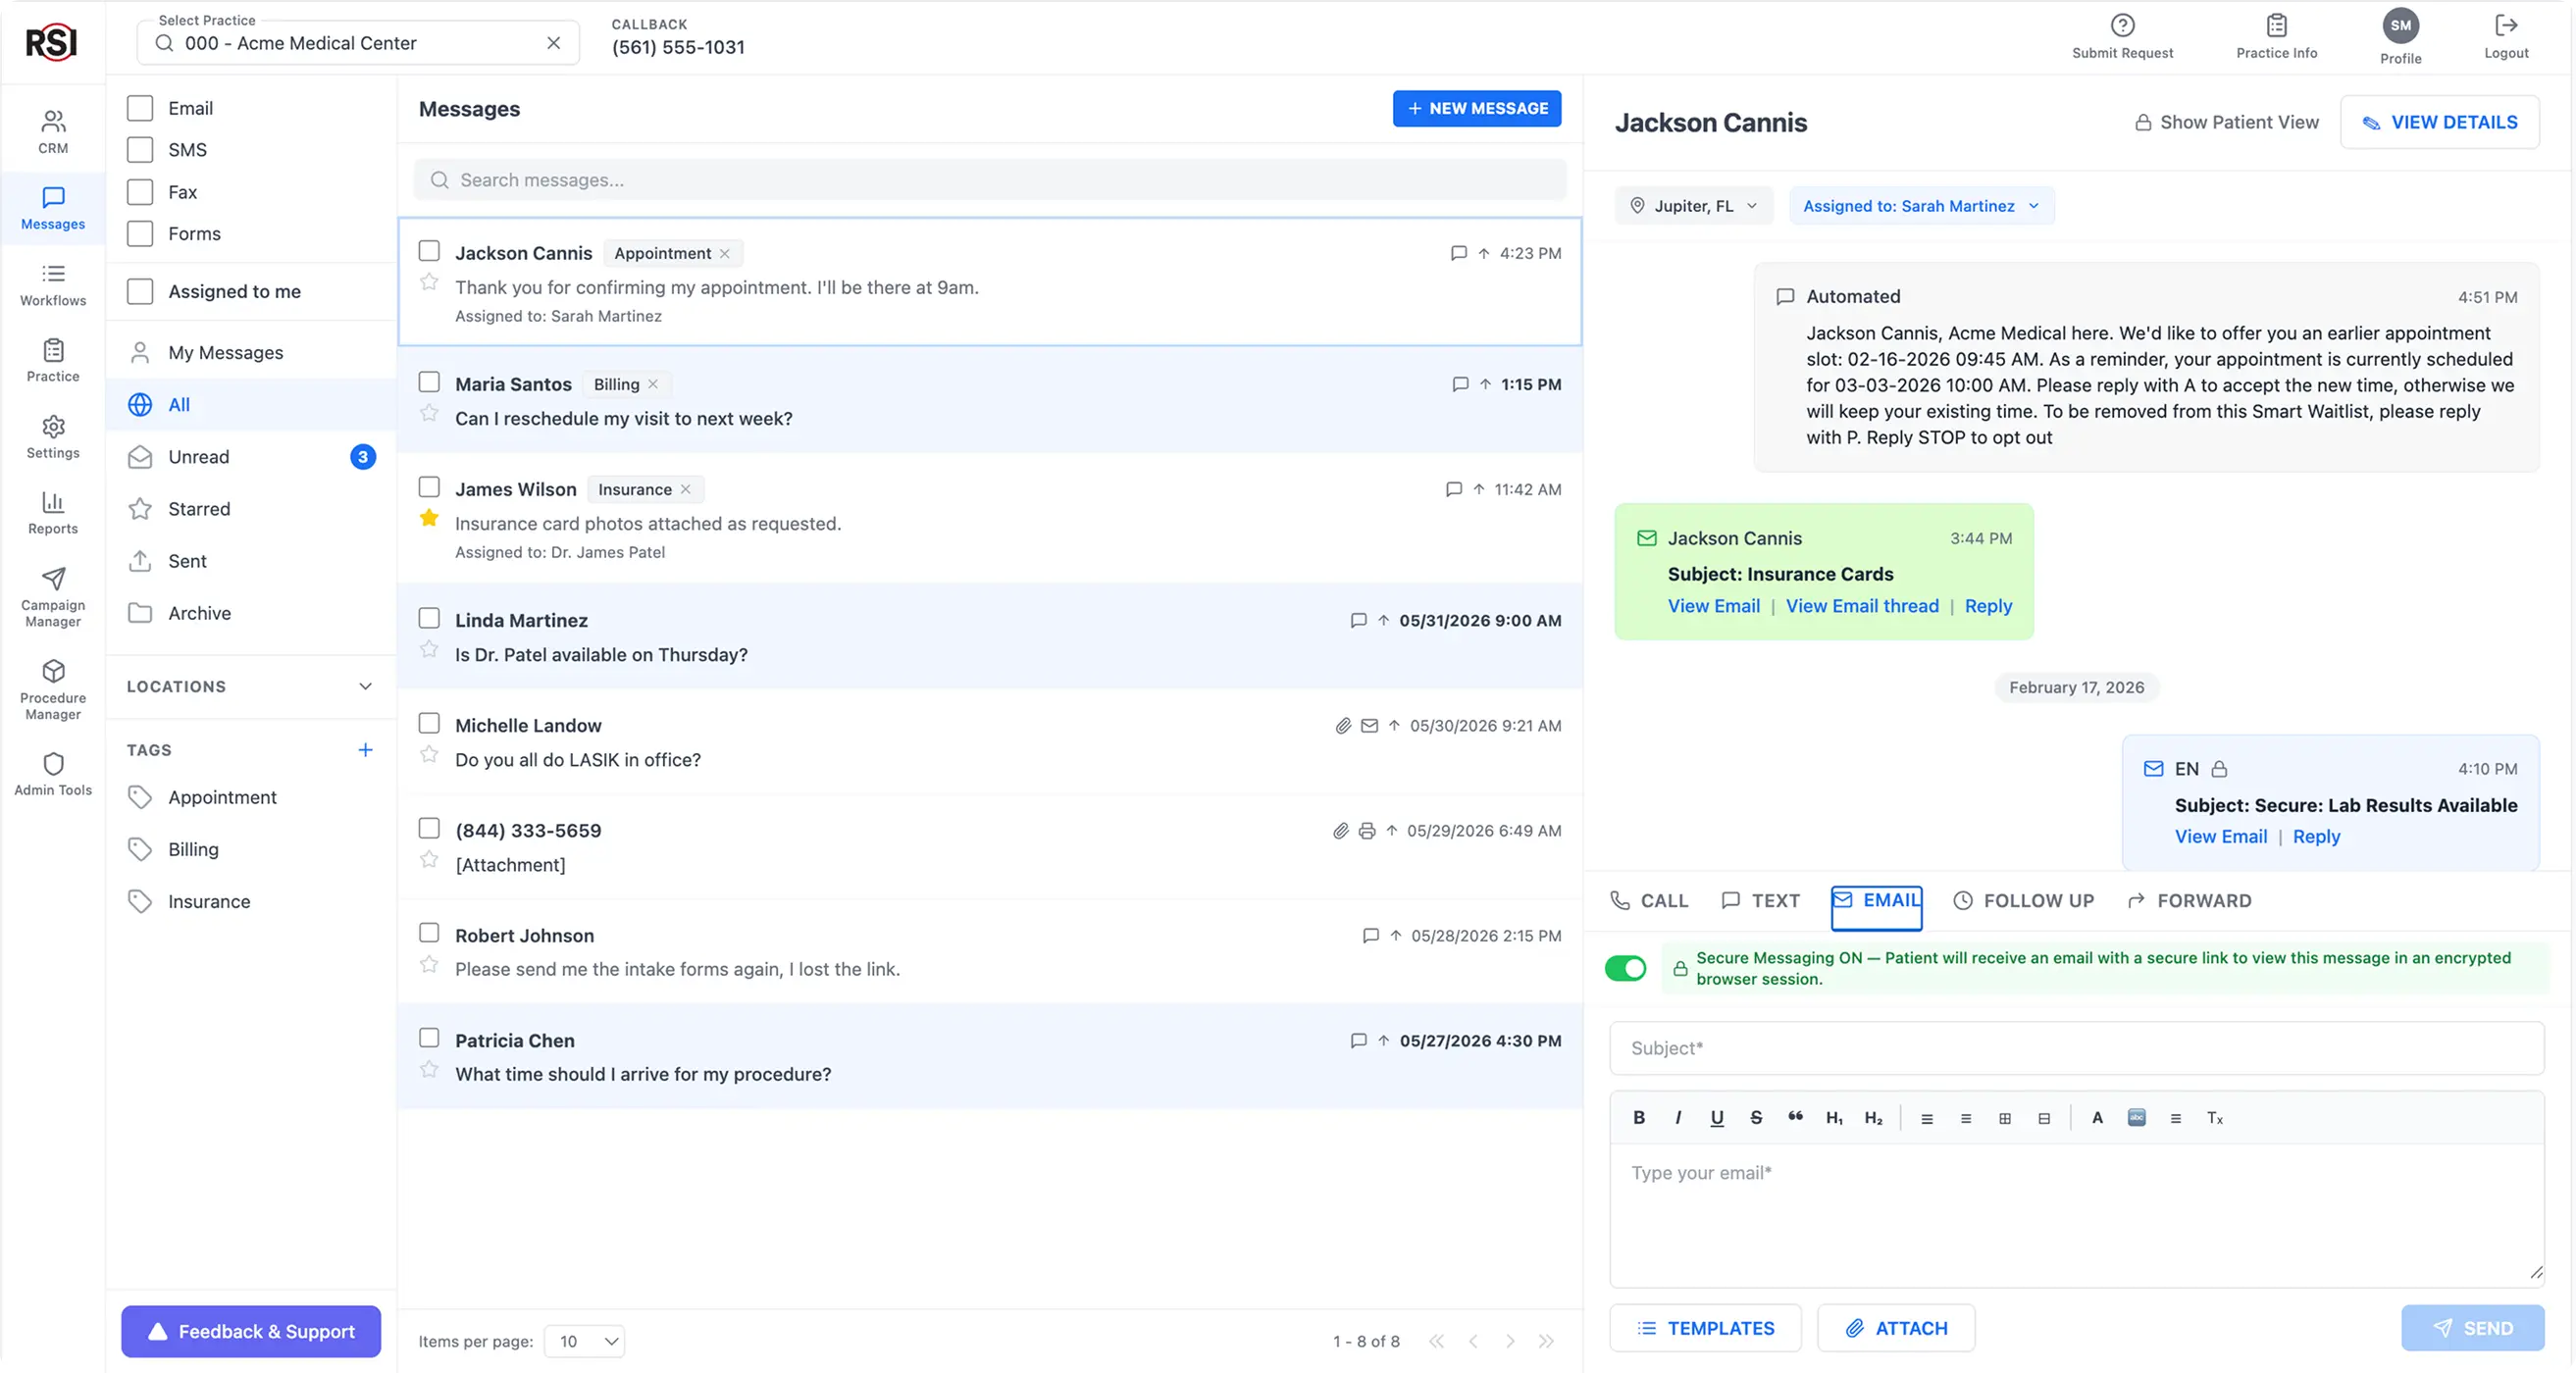
Patient Access Center

Calls, texts, faxes, and inquiries are coming in, but patients are slipping through and staff turnover is high.

Improve patient engagement and attended visits
Reduce workload with automated workflows
icon

Clinical Operations

You’re focused on care, but gaps happen before and after visits.

Keep patients on track
Better visibility across the entire journey
RSI CRM surgery list for the next 7 days alongside a patient to-do list showing workflow stages from pre-scheduling through surgery completion.Red grow gradient
Unhappy patient outreach list alongside patient relationship dashboard showing 85% satisfaction score, survey results, and satisfaction by location.Red grow gradient
icon

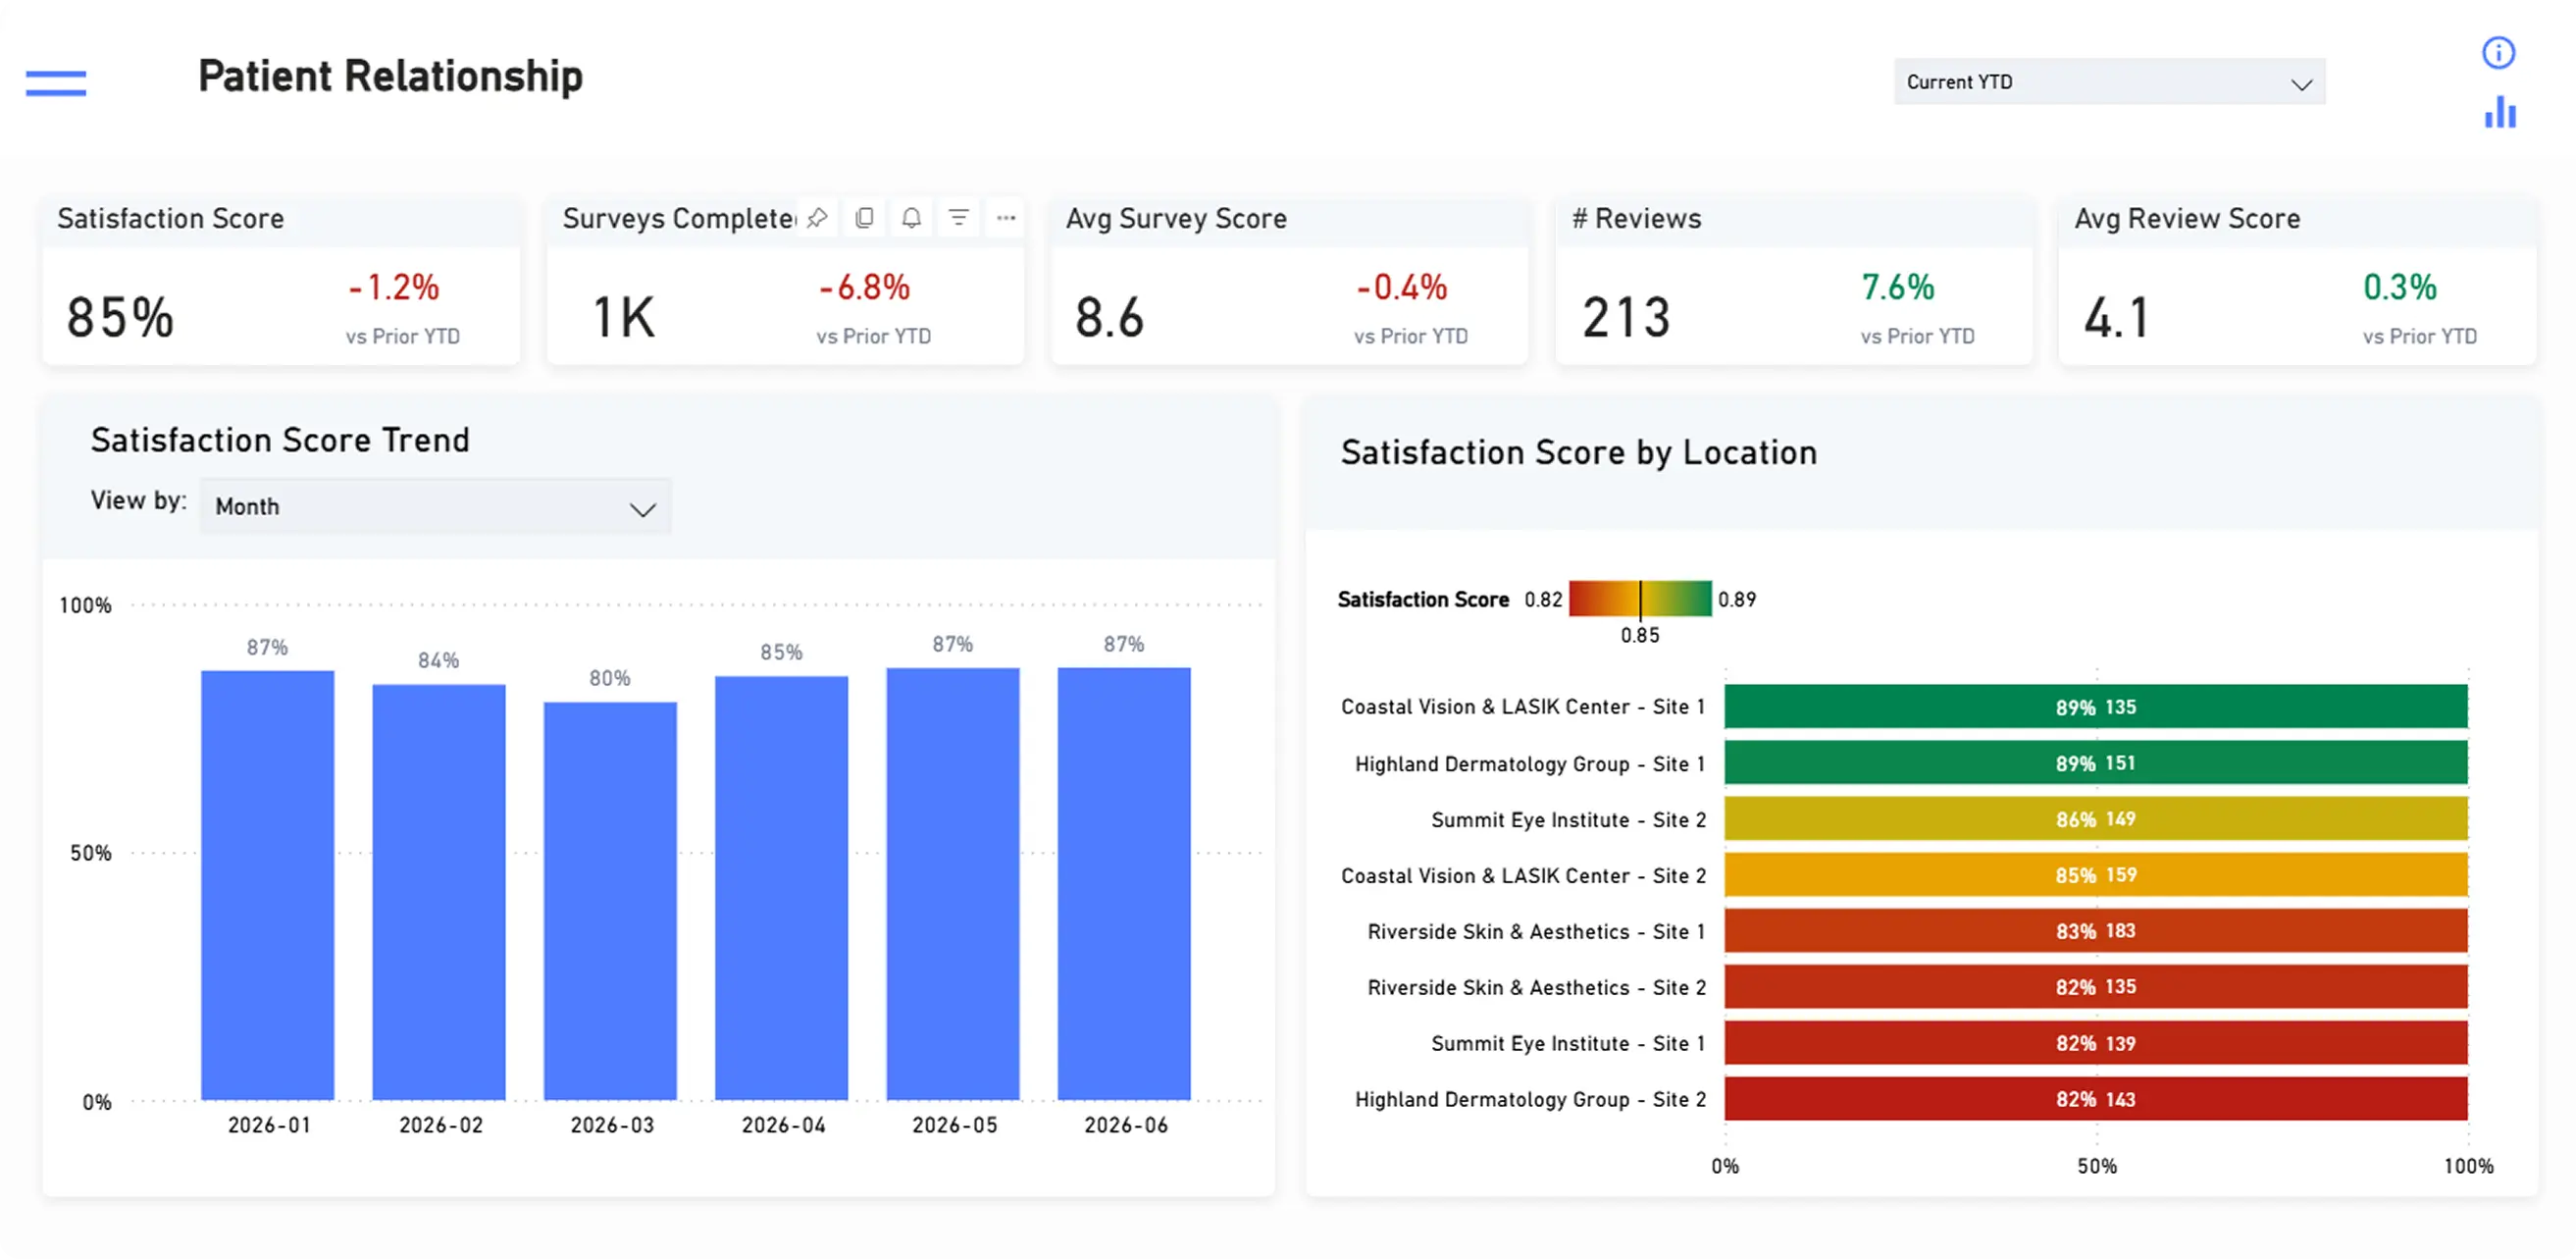
Patient Experience Management

The experience feels fragmented because the systems are.
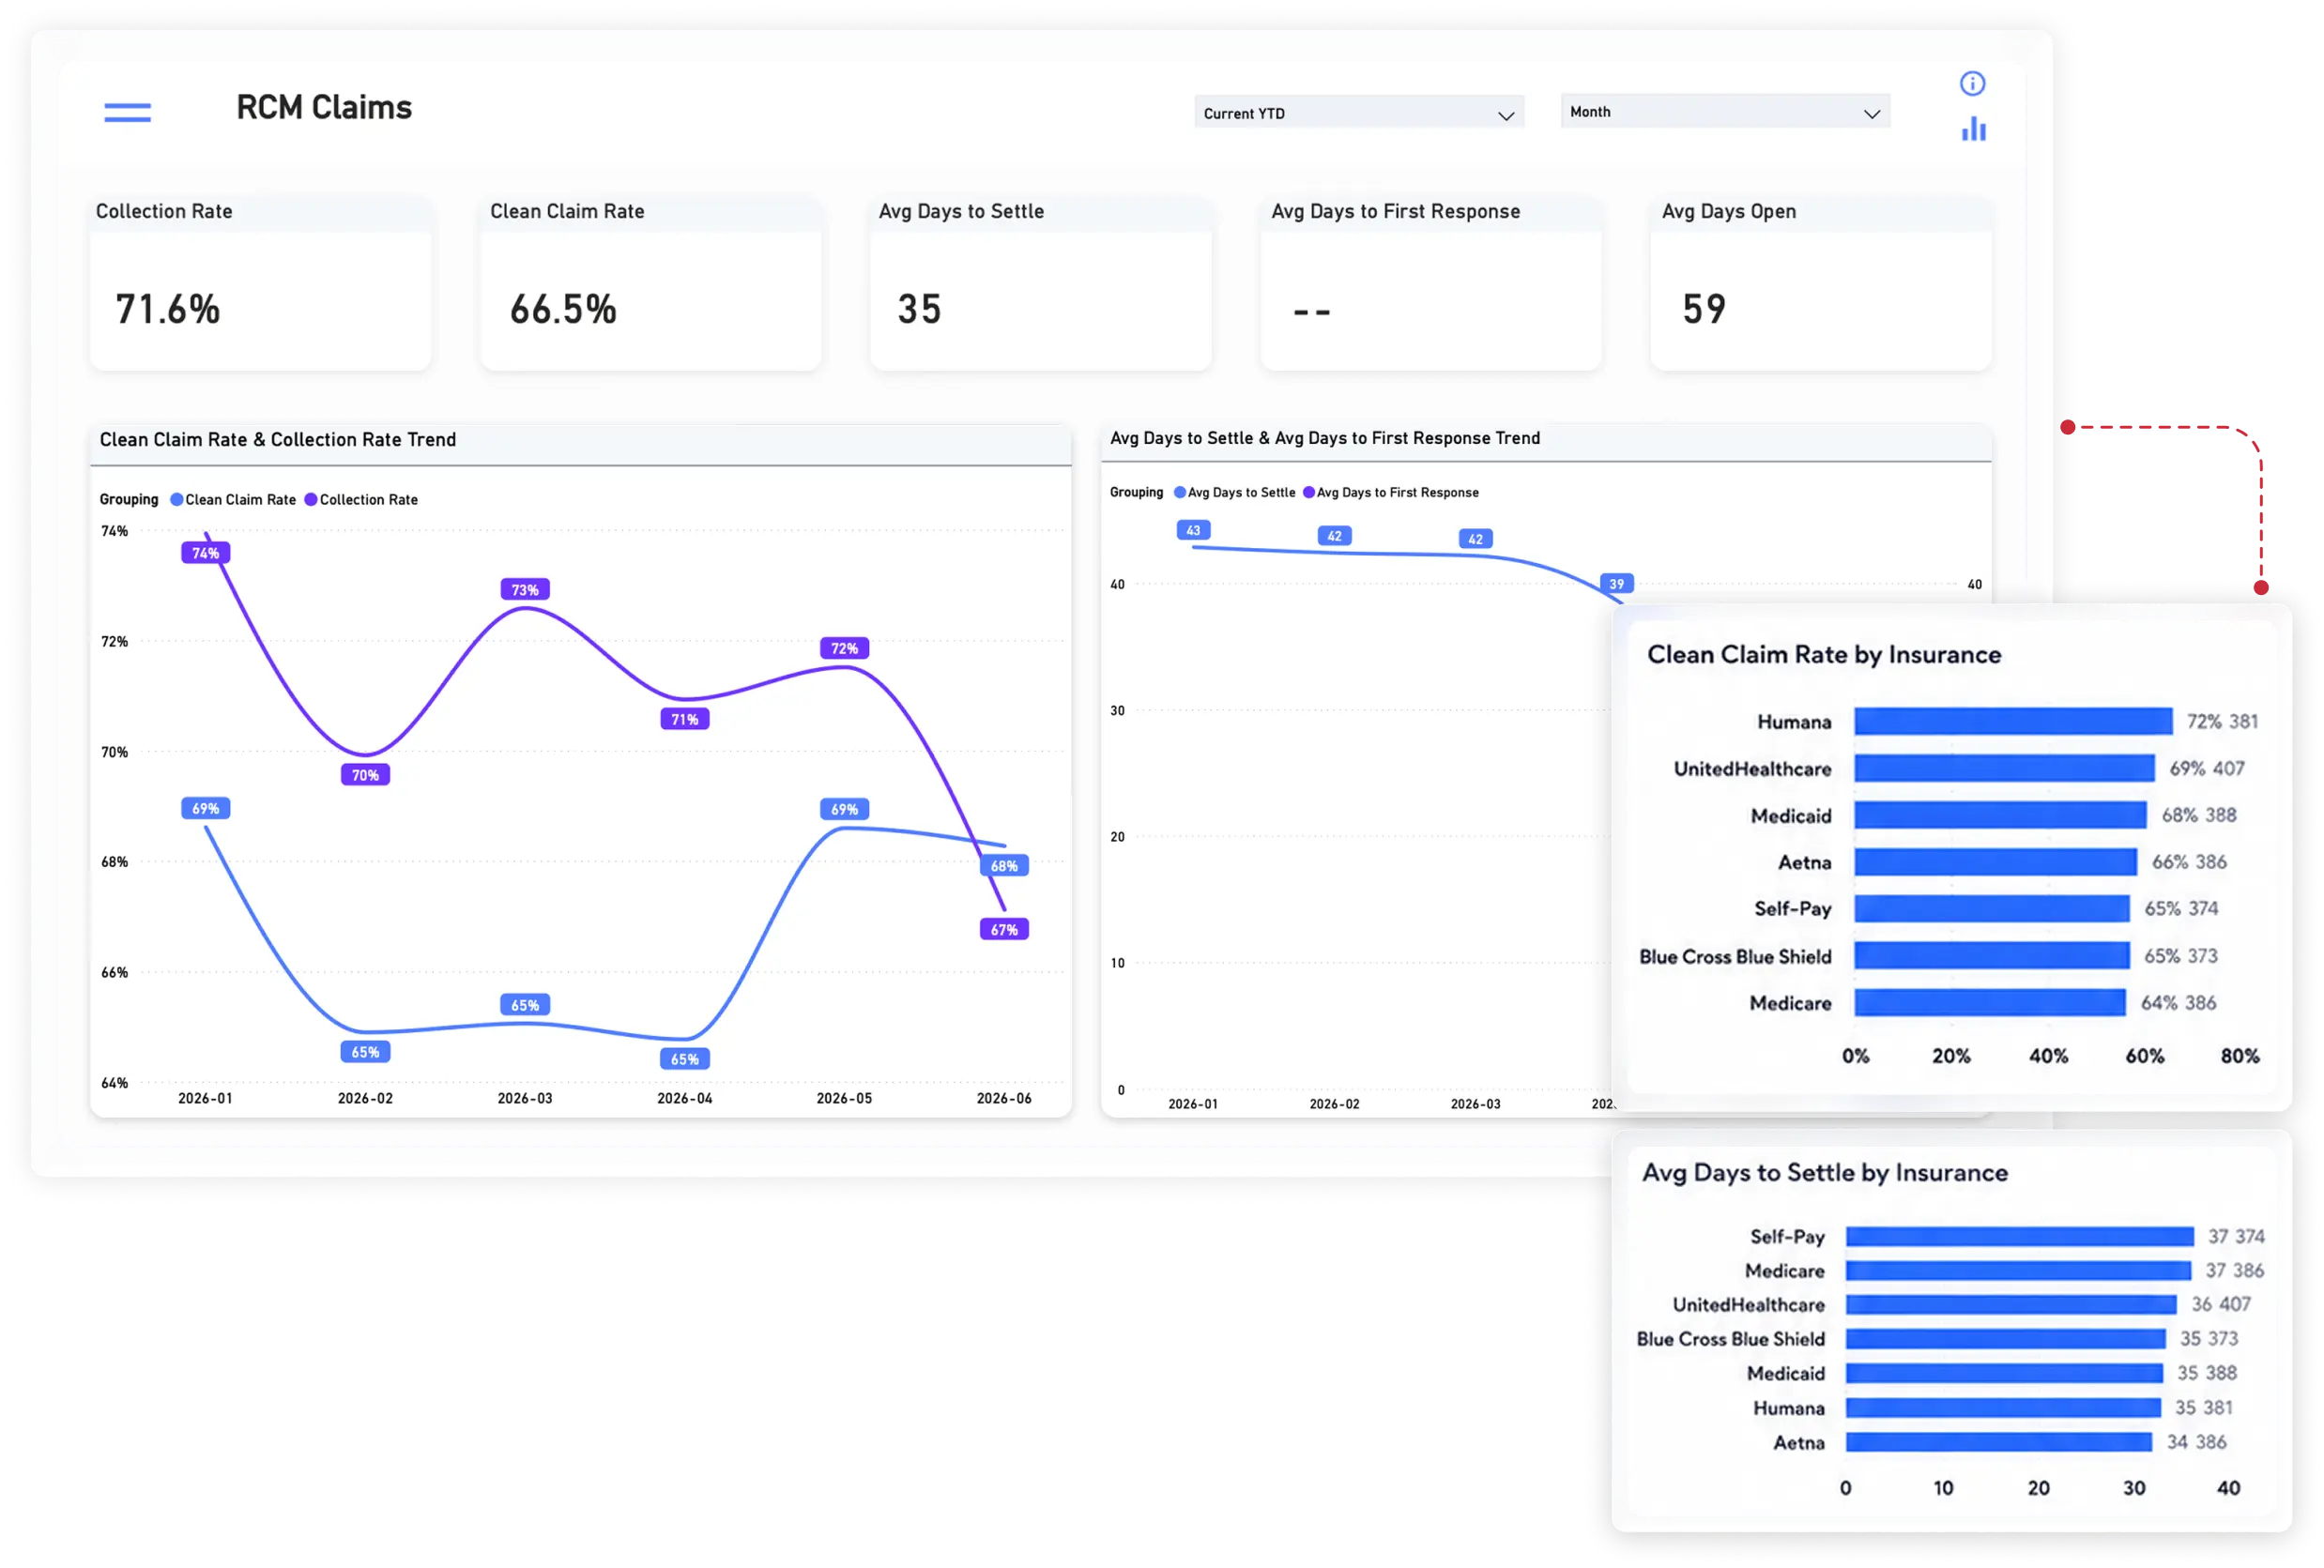
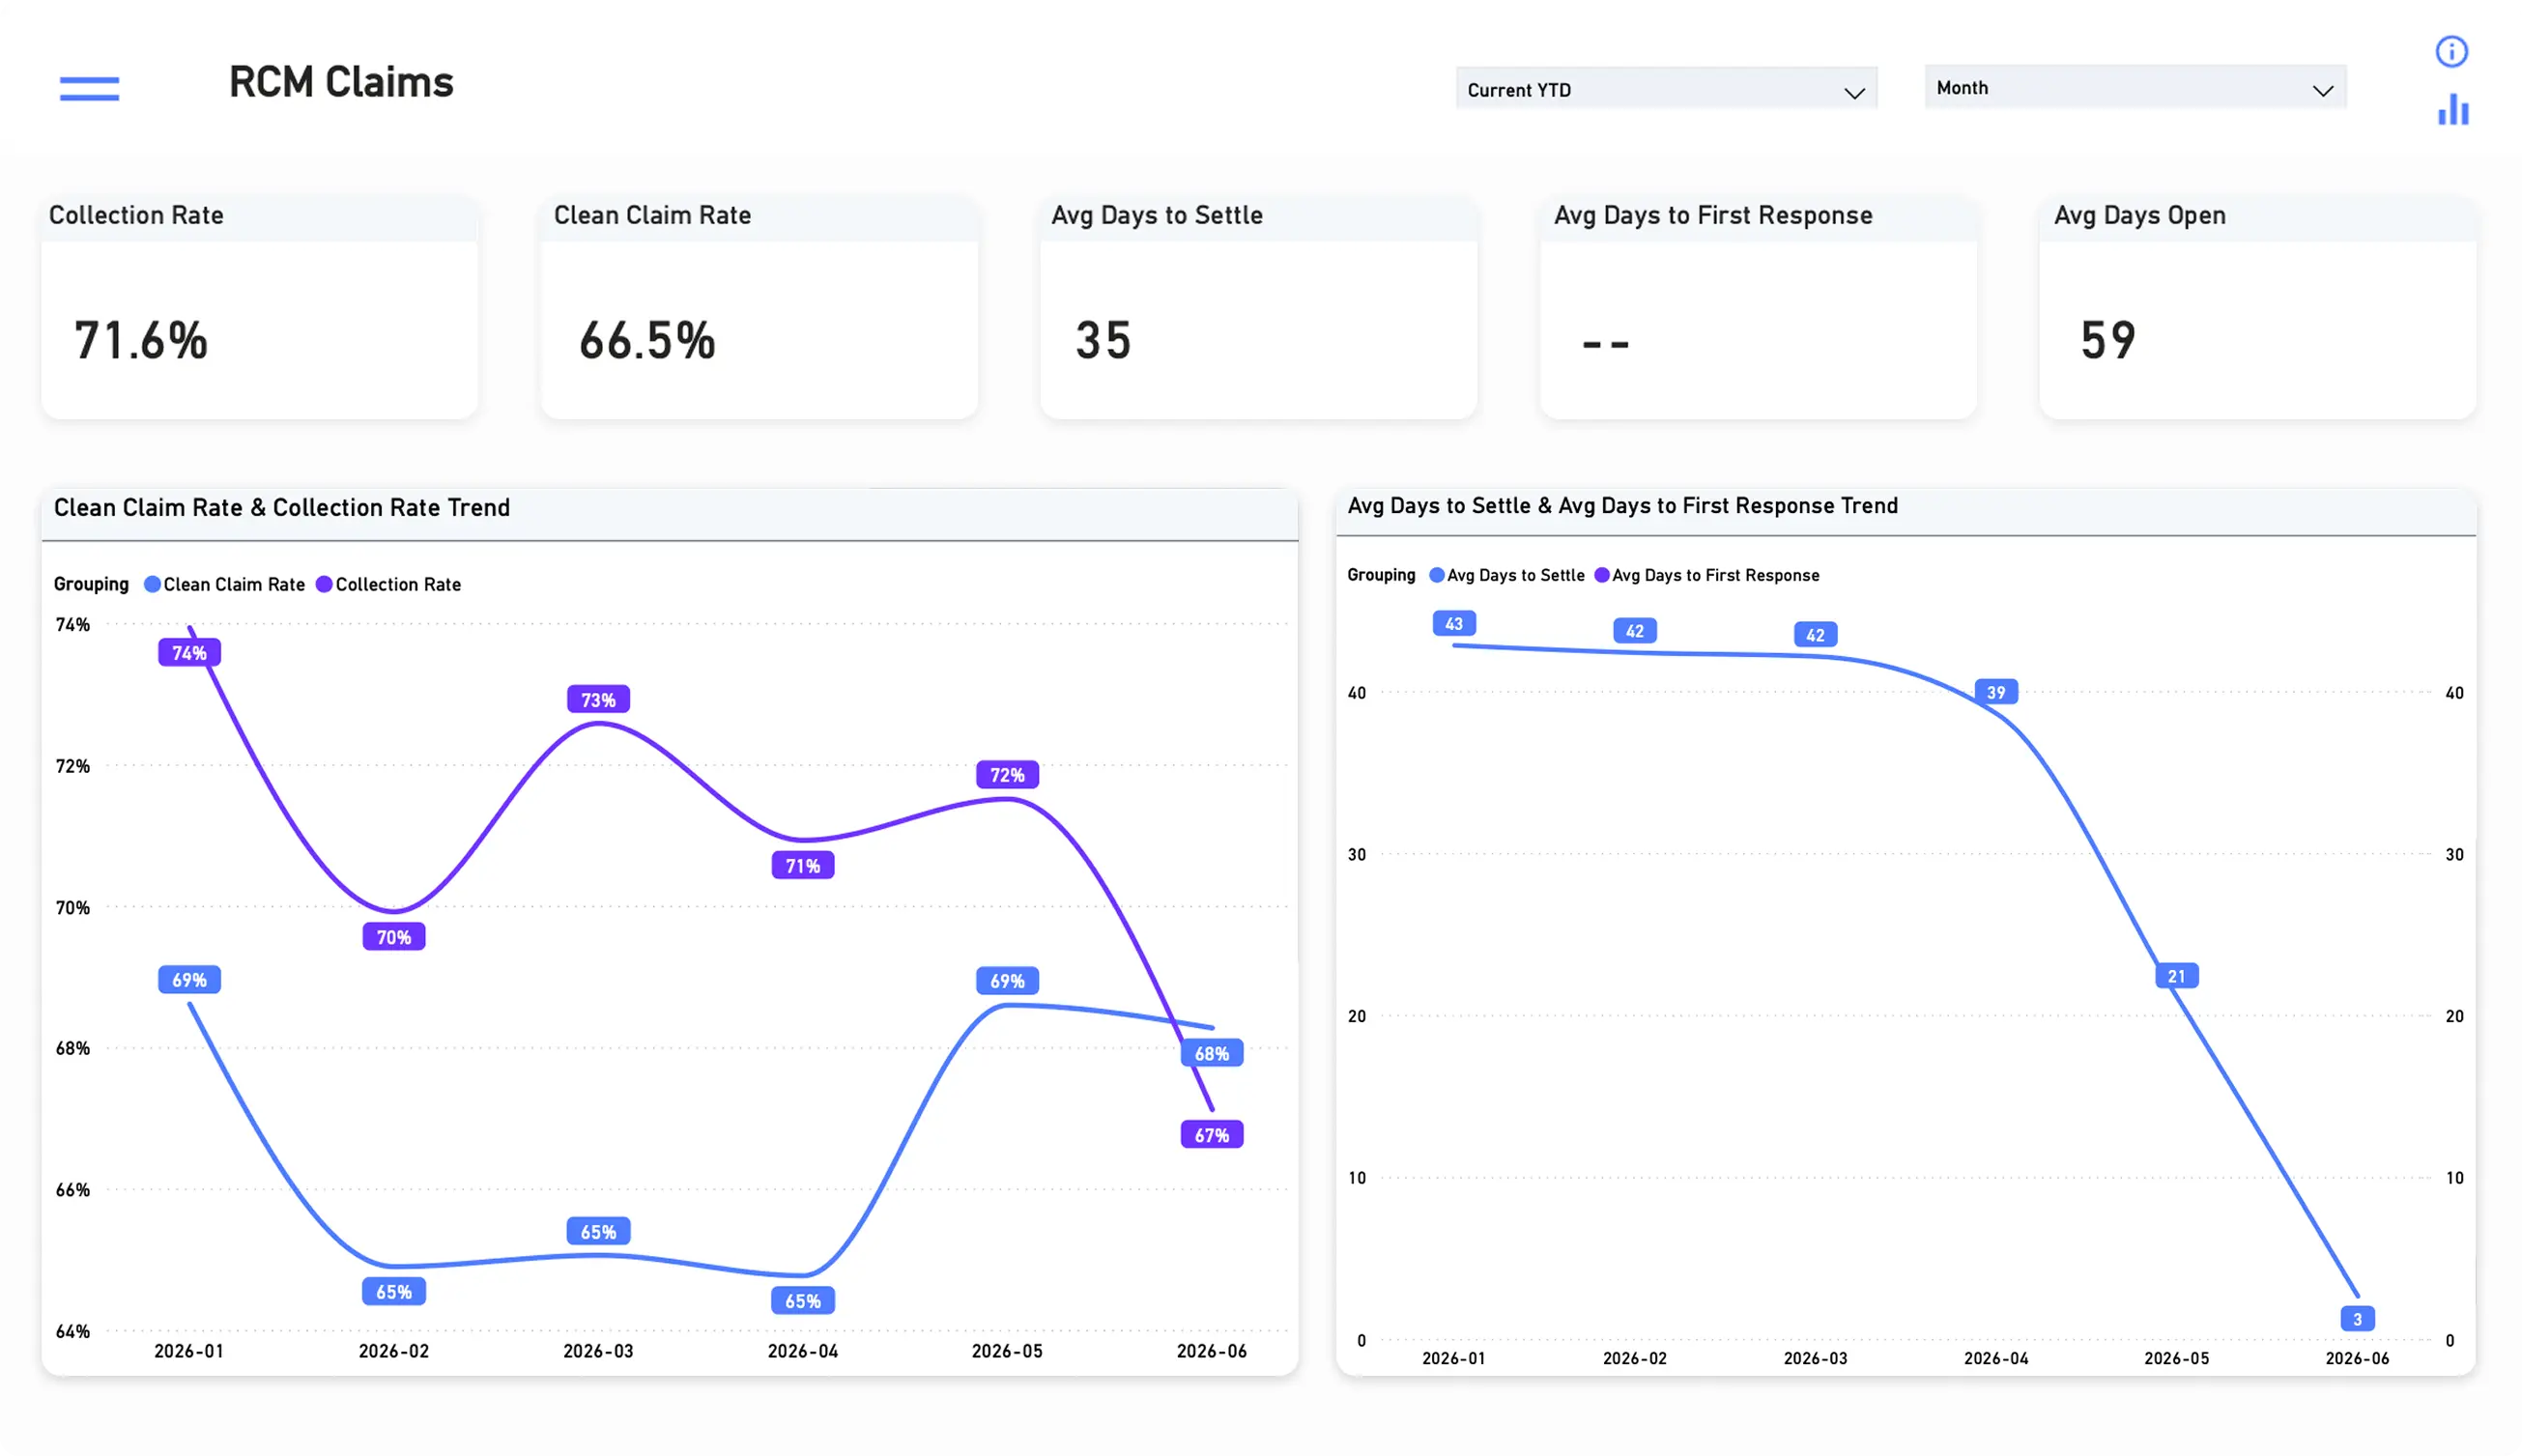
Connect every touchpoint
Create a more consistent and seamless patient journey
icon

Medical Billing

Revenue issues don’t start in billing, but you feel the impact.

See where all breakdowns happen
Improve how revenue is captured and collected
RCM claims dashboard showing 71.6% collection rate, 66.5% clean claim rate, and settlement trends alongside collection and clean claim rates broken down by insurance payer. Red grow gradient

Ready to see your practice work as one?

From marketing to billing, RSI brings every team onto the same system so your entire practice can see what's happening and improve it together.

RSI lead trend dashboard
RSI appointment finder showing available time slot